


Decode Options Data with Clarity
Analyse open interest, price behaviour, and market positioning using structured option analytics—designed to support informed decision-making



About Option Analytics
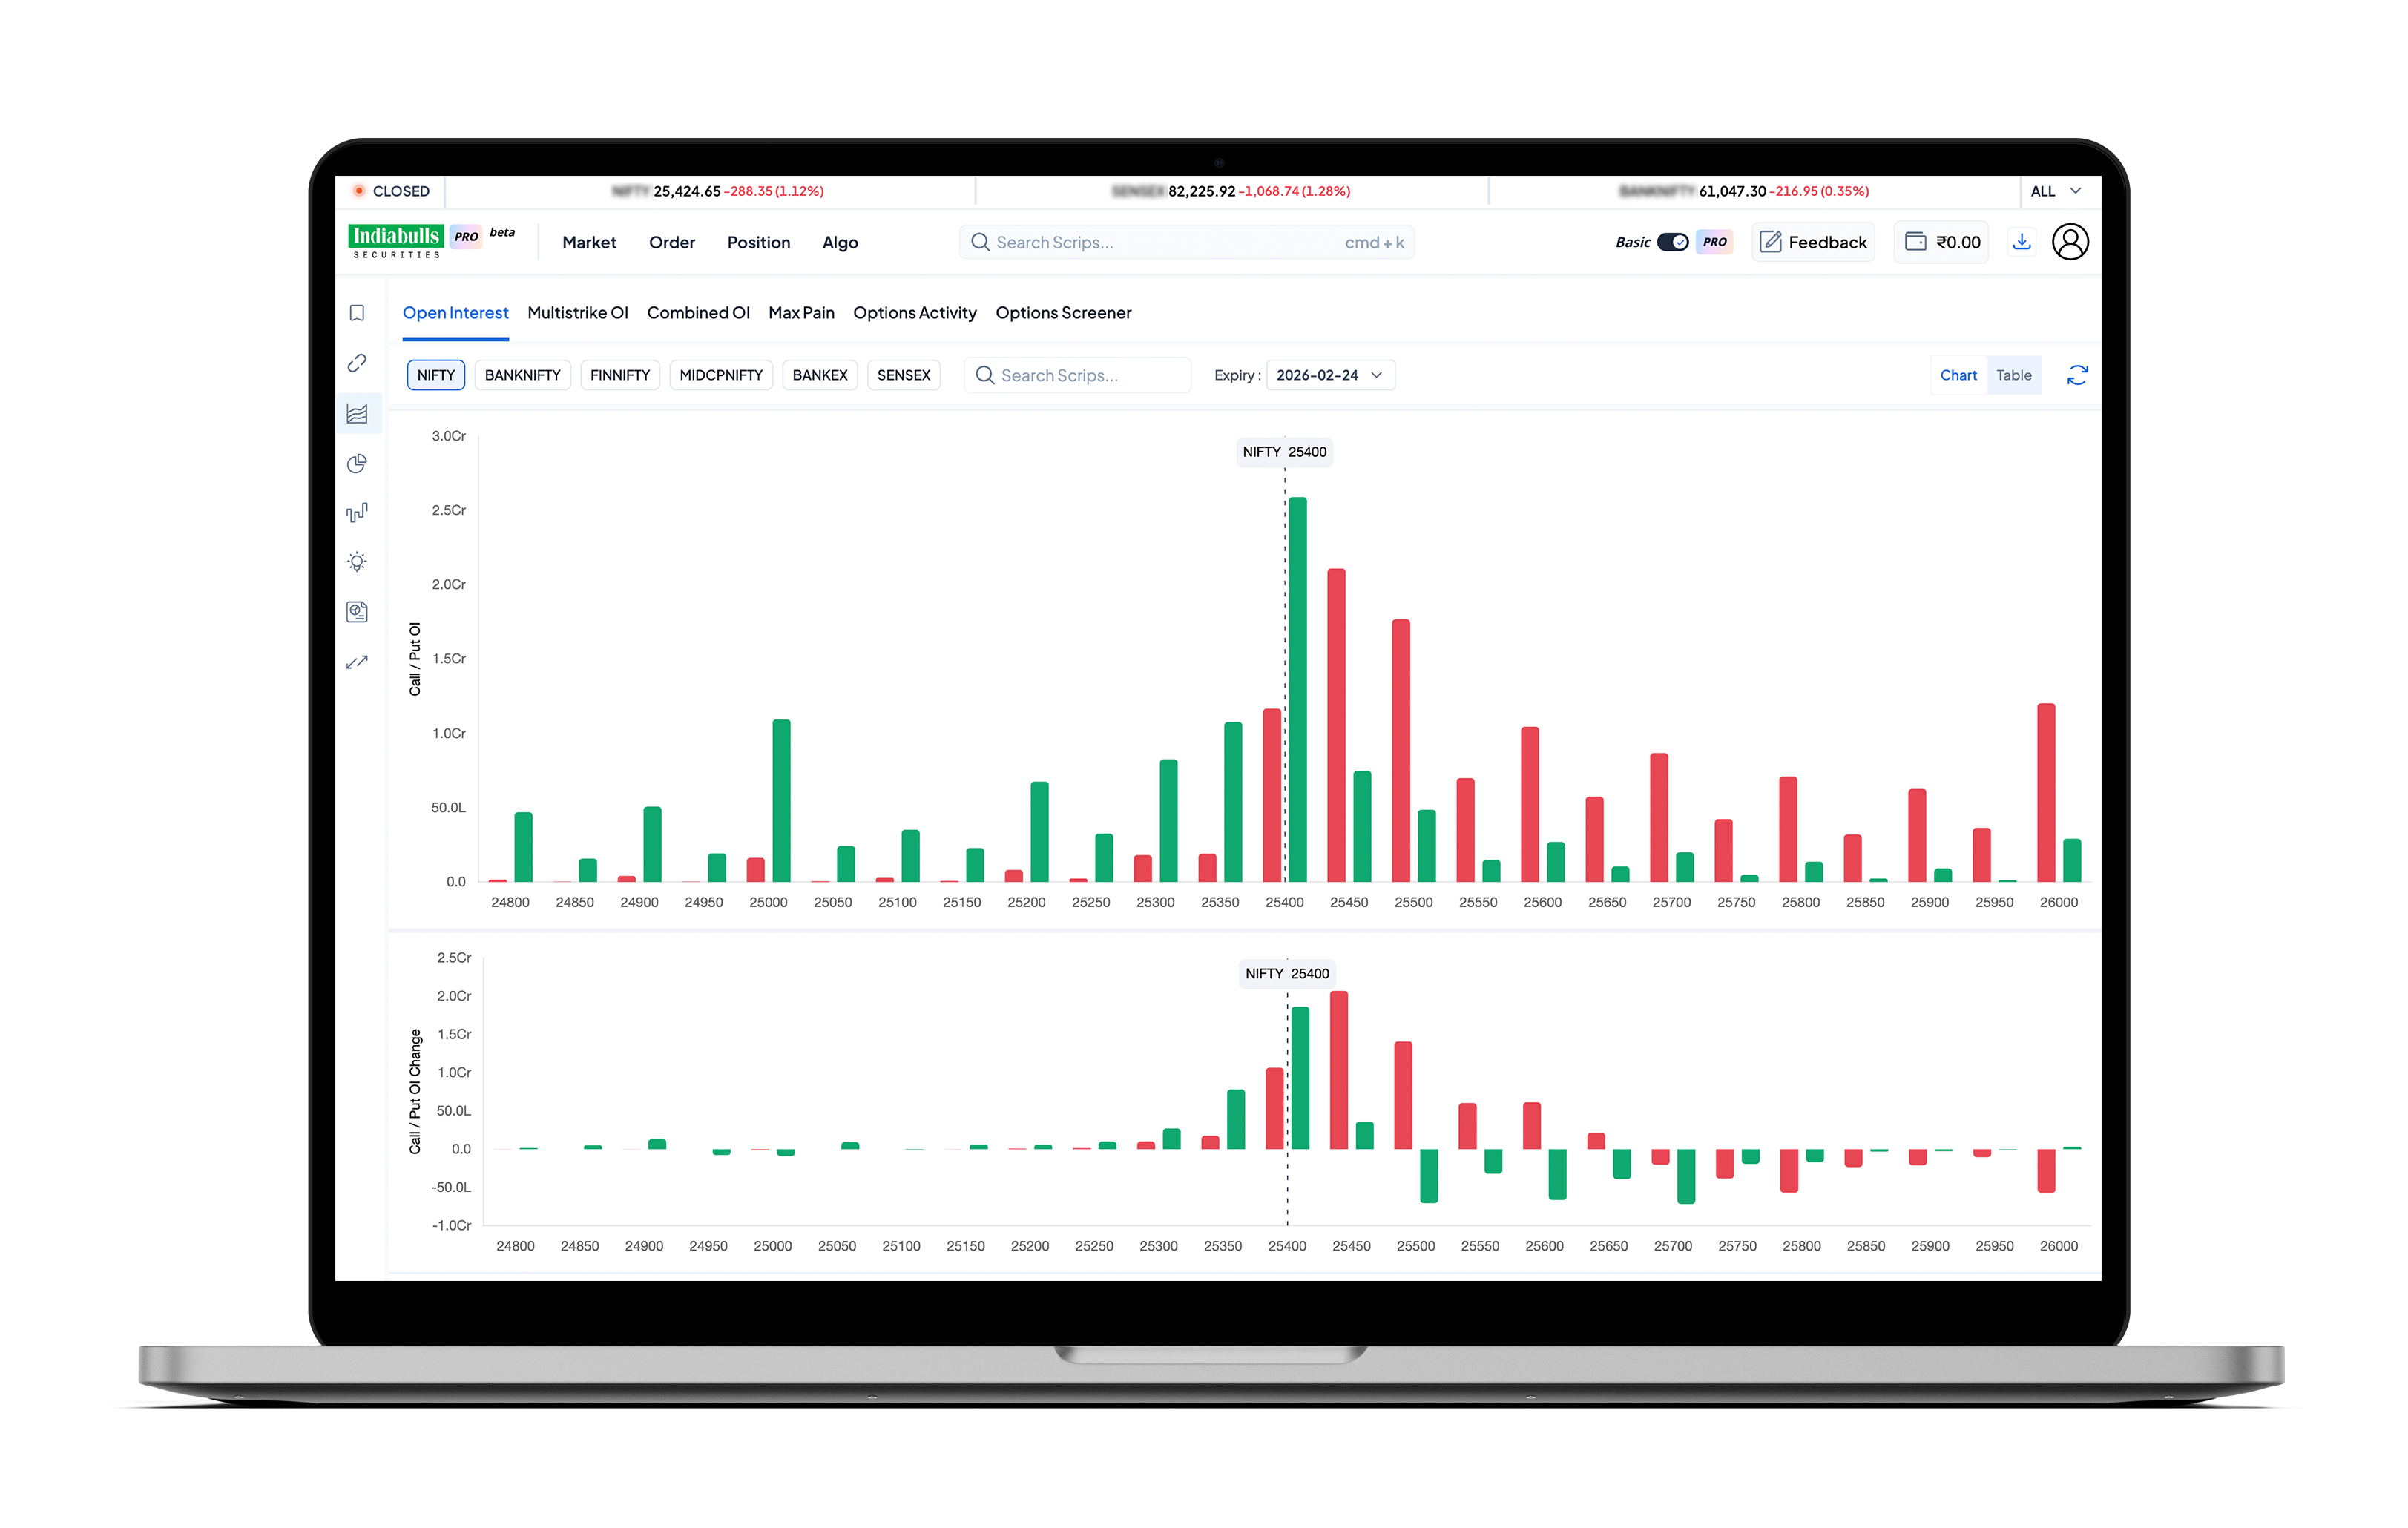
Open Interest Analytics
Because in options trading, knowing where the positions are matters more than knowing where the price is. Price shows movement — Open Interest shows commitment. For serious options traders, price alone is never enough. What truly matters is where money is entering, holding, or exiting the market. Open Interest Analytics is designed to uncover the intent behind every move, helping you trade with data-backed clarity — even before you log in.
OI Overview
The OI Overview presents a consolidated view of open interest across indices and stocks, helping traders instantly identify whether positions are being added, built, or unwound.
Unlike charts that only reflect price, OI tells you whether traders are confident enough to commit capital.
Why it matters to option traders:
- • Identify long buildup, short buildup, short covering, and long unwinding
- • Confirm whether price movement is supported by real participation
- • Understand market sentiment beyond candles
Best used for:
Intraday bias, trend validation, and expiry-day context.
Multi-Strike OI
Follow the Smart Money Across Key Strike Prices
Markets don’t react at a single level. Multi-Strike OI allows traders to monitor open interest changes across up to 6 strikes, over multiple timeframes.
This reveals where traders are positioning themselves — at, above, and below the spot price.
Why it matters to option traders:
- • Identify strong support and resistance zones
- • See which strikes are being actively defended or attacked
- • Improve strike selection instead of guessing ATM levels
Best used for:
Spreads, straddles, strangles, and expiry-based strategies.
Combined OI (Call + Put)
Tracking Calls and Puts separately can create noise. Combined OI aggregates total Call and Put open interest to provide a clean directional snapshot.
This helps traders quickly understand where the balance of risk lies.
Why it matters to option traders:
- • Spot bullish or bearish dominance at a glance
- • Detect early shifts in market positioning
- • Make faster decisions during volatile session
Best used for:
Intraday directional trades and bias confirmation.
Max Pain
Understand Where Option Writers Are Most Comfortable
Max Pain highlights the strike price where option sellers face the least loss, based on total open interest. This level often acts as a reference zone, especially closer to expiry.
It’s not a signal — it’s context.
Why it matters to option traders:
- • Helps plan range-bound and non-directional strategies
- • Acts as a potential price magnet near expiry
- • Adds depth when combined with OI buildup and price action
Best used for:
Expiry strategies, iron condors, and short volatility trades.
How Traders Use Open Interest Analytics

Combine price + OI to validate true market strength
Avoid false breakouts with weak participation
Select better strikes with higher probability
Read positioning before volatility expands
Trade With Intent, Not Assumptions
Open Interest Analytics turns raw derivatives data into actionable insight, helping you understand where traders are positioned and why price is reacting.
Because the best option trades are taken with insight — not hindsight.
Glossary
Involves studying the total number of outstanding futures and options contracts to gauge market sentiment, activity, and potential price trends, revealing if new positions are being created or existing ones closed, often visualized through OI charts and heat maps to identify strong support/resistance levels and market conviction. It differs from volume by tracking active positions, not just trades, and is crucial for understanding liquidity and identifying bullish (rising price/OI) or bearish (falling price/rising OI, or high OI with price drops) scenarios, helping traders anticipate market shifts and liquidity hotspots
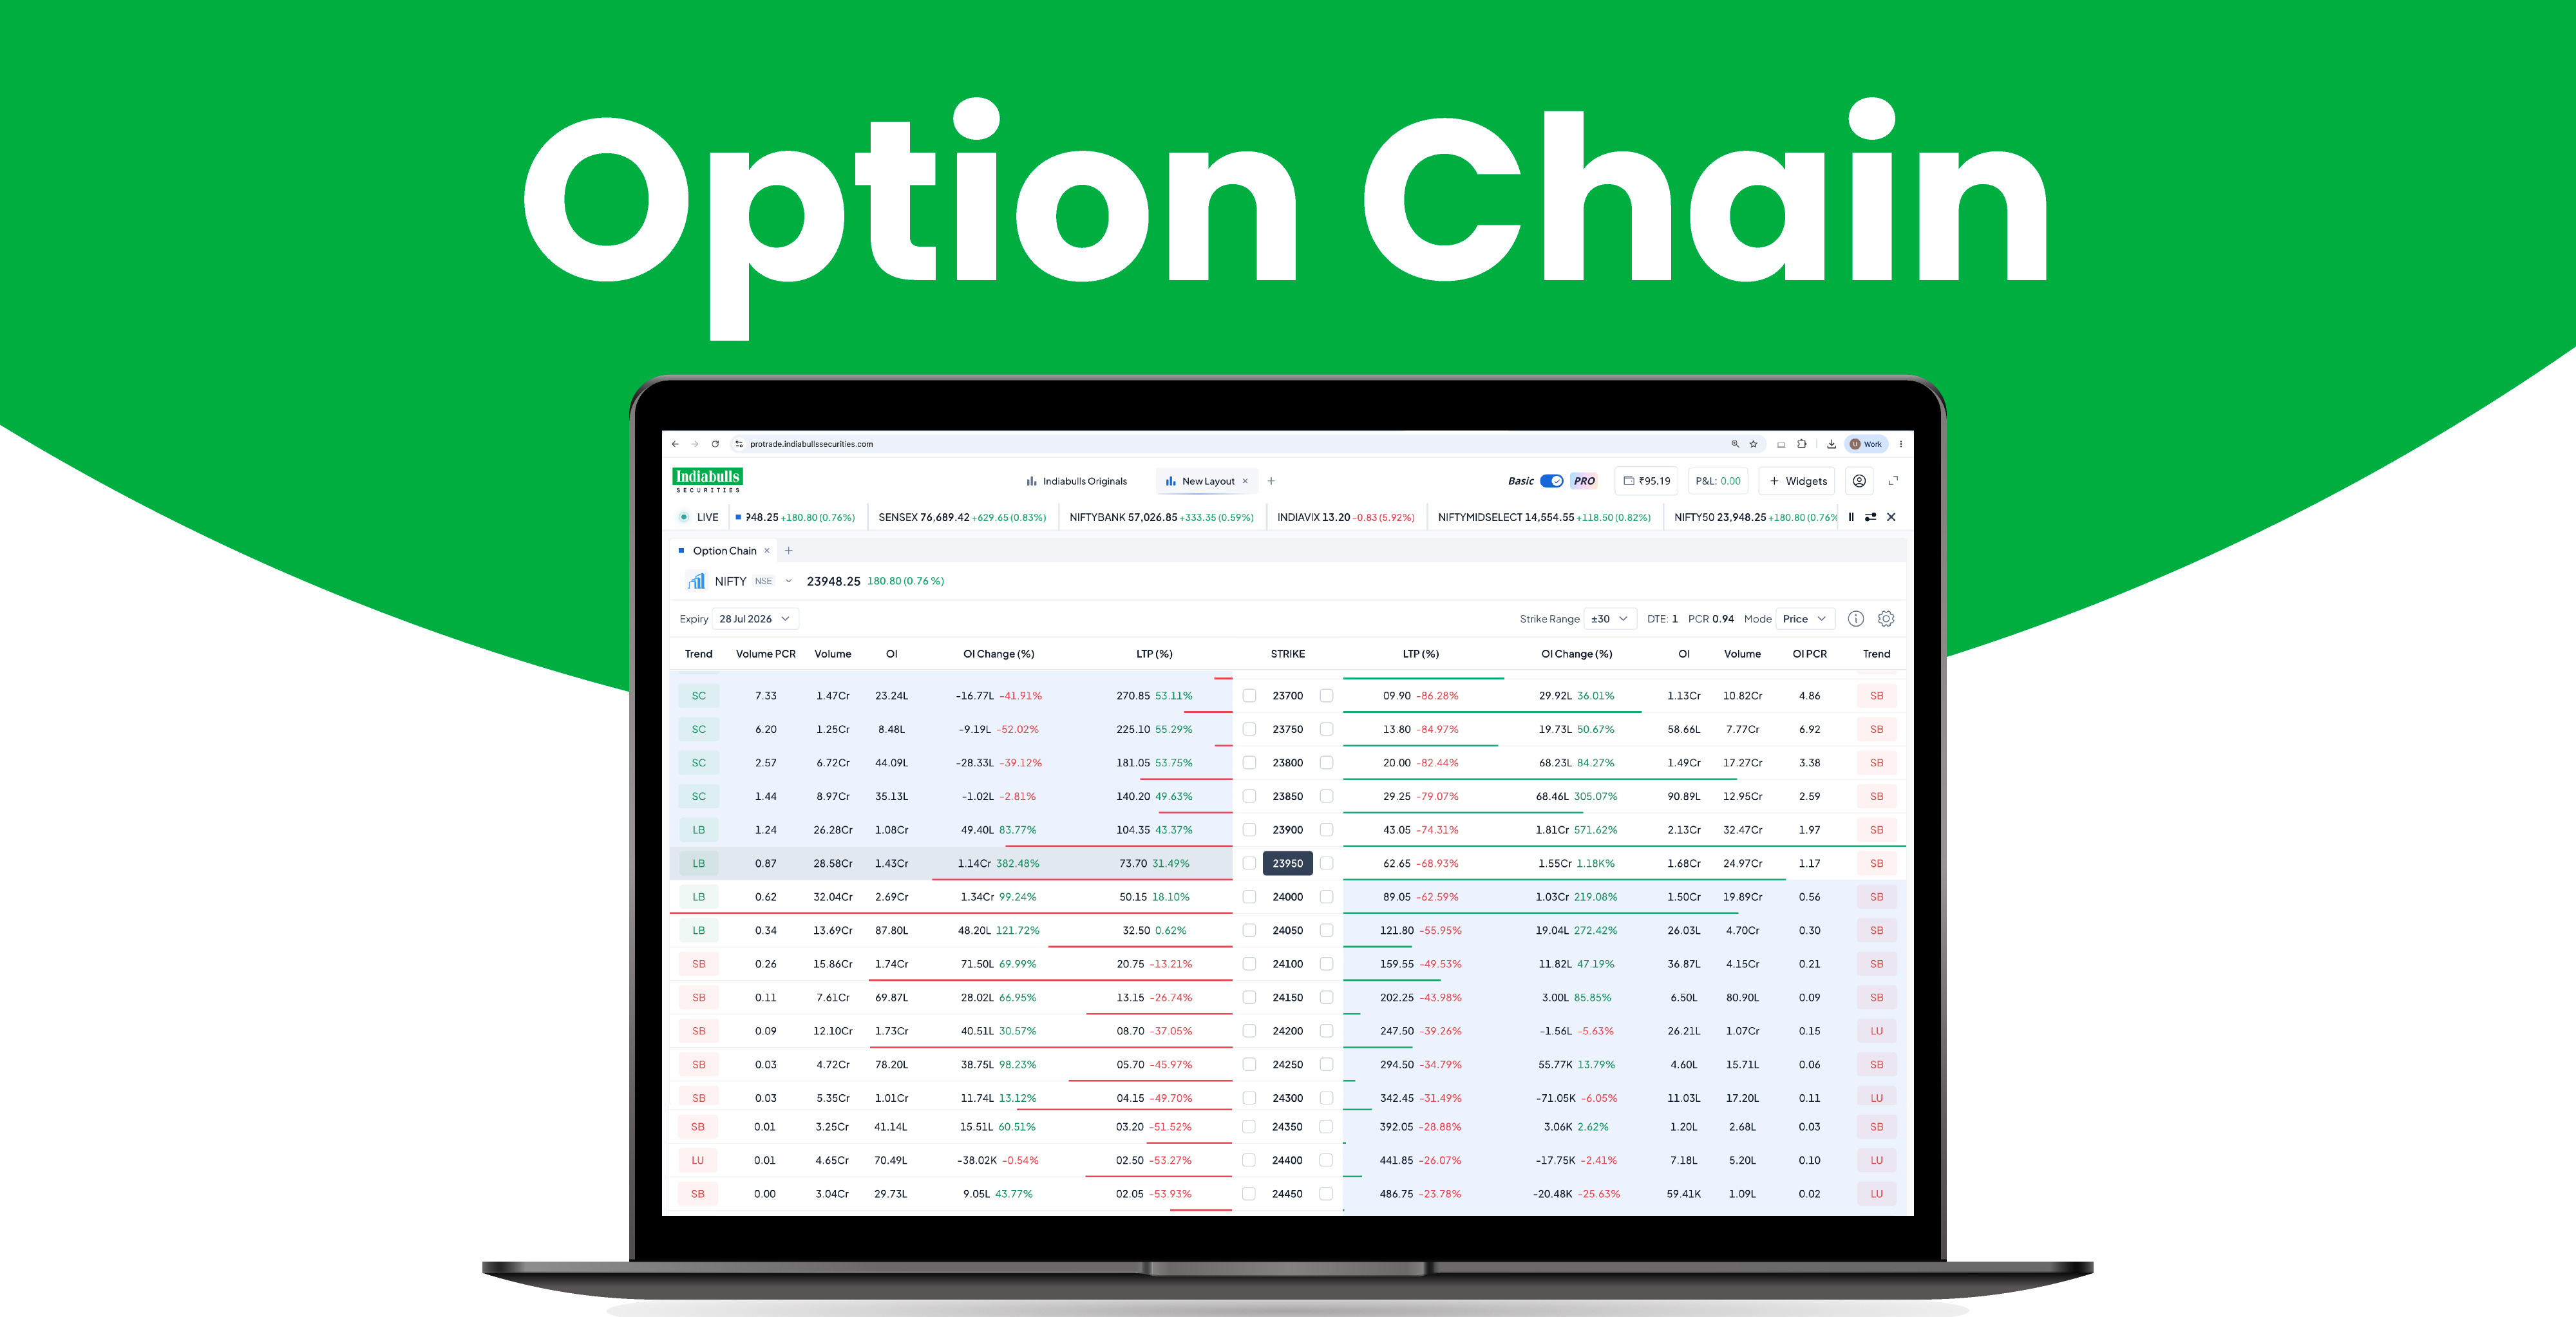
Option Chain Analysis: How to Read an Option Chain Step by Step
What each column in an option chain means, how to read open interest for support and resistance, and how to use the PCR, Straddle and Greeks views on IBT-ProTrade.
Read More
What is Implied Volatility in Options?
Understand what implied volatility means in options, how it affects option premiums, and why traders consider it when evaluating potential market movements and strategies.
Read More
What is Strike Price in Options?
Understand what a strike price means in options trading, how it works for call and put options, and why it matters when evaluating an options contract.
Read More
What Are Index Options and How Do They Work?
Understand index options, how they work, their key features, benefits, risks, and how traders can use them to manage market exposure effectively.
Read More
How to Choose the Right Strike Price in Options Trading
If you are a novice stock market investor and are starting to look into options trading for beginner...
Read More
Options Screener : How to Scan Every Active Contract by OI, Price and Volume
How to use the Activity lenses, what OI gainers and losers actually tell you, and how to read premium and open interest together on IBT-ProTrade.
Read More
Frequently Asked Questions
Option Analytics is a data-based tool that helps users analyse options market participation using Open Interest (OI), OI Change, Combined OI, Multistrike OI, and Max Pain metrics.