

The textbook target on a cup and handle pattern is reached only about 6 times in 10. Author and trader Thomas
Bulkowski reports it on his website (updated July 2025), from 913 bull-market trades, mostly in US stocks. Spotting the shape is easy; the real test is whether the trade still works when the move falls short. Below are five numeric tests and one priced rupee trade.
What Is the Cup and Handle Pattern?
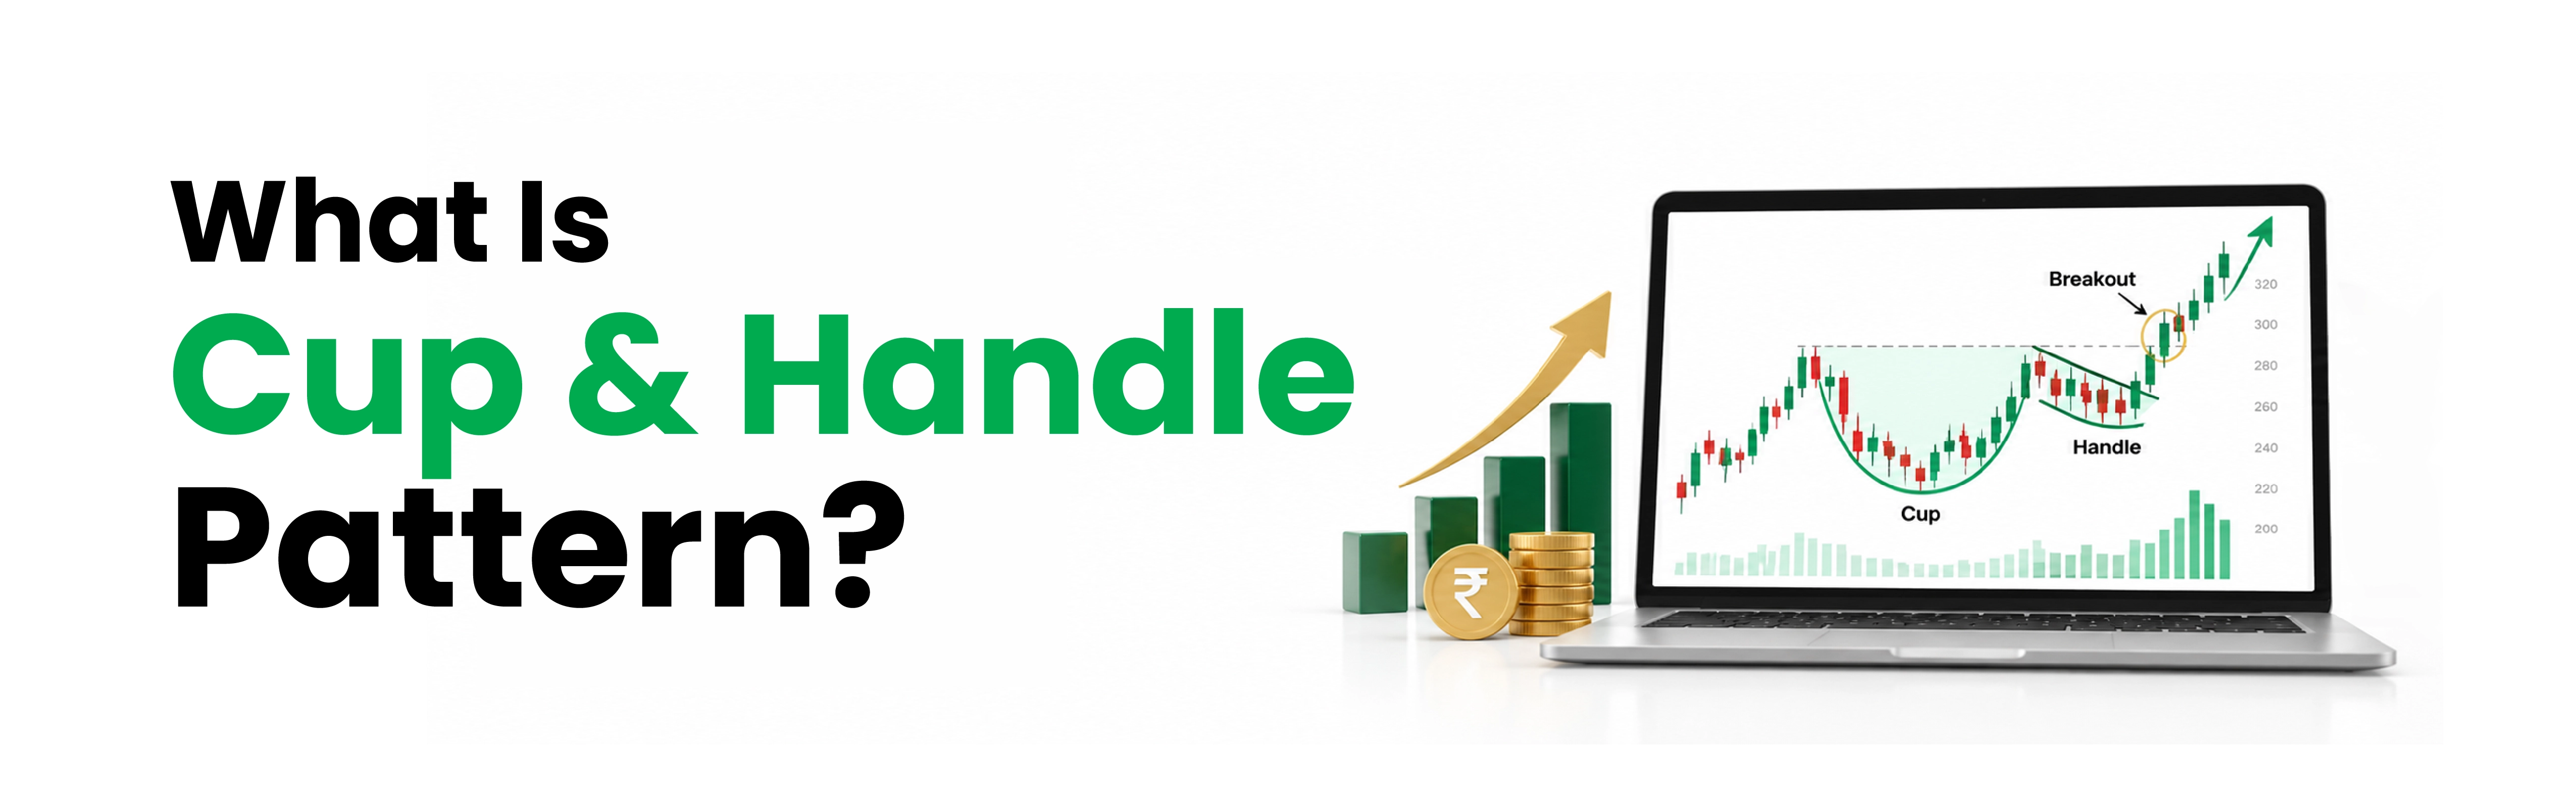
The cup and handle pattern is a bullish continuation chart pattern used in technical analysis, usually on daily or weekly charts. It signals that a rising stock has paused and may resume its advance. William J. O'Neil, founder of Investor's Business Daily (IBD), set out its rules in his 1988 book How to Make Money in Stocks.
The cup is a rounded, U-shaped dip and recovery towards the earlier high. The handle is a shorter, shallower pullback near that high, shaking out impatient holders before price breaks above the handle's top, called the pivot.
Because a cup takes weeks to form, the setup suits swing trading and positional holding.
Also Read: To understand how other chart formations can help traders interpret price movements, explore Candlestick Patterns Every Trader
Should Know.
How to Identify a Cup and Handle: Five Tests
A rounded dip near an old high is not automatically a cup. Run these five tests from O'Neil's criteria first:
• Prior rise: the stock gained at least 30% before the cup began.
• Depth: the cup corrected 12% to 33% from its left rim.
• Shape and length: a rounded U, not a sharp V, lasting at least 7 weeks.
• Handle: it sits in the upper half of the cup and drops no more than 15%.
•
Volume: breakout volume runs at least 50% above its
50-day average.
In IBD research, most handles in the most successful stocks dropped no more than 8% to 12%. To check position, mark the cup's midpoint; a handle low beneath it fails.
Trading Cup and Handle Breakouts: Entry, Stop-Loss and Target
A cup that passes all five tests gives you three prices to plan around. A stop-loss is an order that exits your position automatically at a preset price.
• Entry: just above the pivot, once the volume test is met.
• Stop-loss: just below the handle low.
• Target: the cup's depth, from rim to low, added to the breakout price.
Fidelity treats this projection only as a guideline. Bulkowski scales the cup's height by 0.61 first, since only 61% of patterns in his study reached the full measure.
Worked Example: Pricing One Trade
Take a hypothetical NSE-listed stock (illustration only, not a recommendation).
Level | Price | Check |
Prior rise | ₹380 to ₹500 | 31.6%, passes |
Cup low | ₹410 | 18% deep, passes |
Handle low | ₹468 | 6.4% drop, above ₹455 midpoint |
Entry | ₹501 | Just above ₹500 pivot |
Stop-loss | ₹466 | ₹35 risk per share |
Full target | ₹590 | ₹500 + ₹90 depth |
Adjusted target | ₹555 | ₹500 + (₹90 × 0.61) |
At the full target, you risk ₹35 to make ₹89, a risk-reward ratio of about 1:2.5. At the adjusted target, the reward shrinks to ₹54, roughly 1:1.5. If 1:1.5 is below your minimum, a valid pattern is still not worth taking.
Indiabulls Securities charges
₹11 per executed order, across NSE (CM, FO, CD), BSE (CM, FO) and MCX. This round trip costs ₹22 in brokerage; the brokerage calculator gives the full figure.
When the Cup and Handle Pattern Falls Short
A valid cup and handle pattern can break out and then fade. In a review of 300 patterns from 1990 to March
2024, Bulkowski found that 47% dropped substantially within two months of breakout. Almost a quarter rose 15% or less before turning down. That is mostly
US data, but the lesson travels: decide your exit before you enter.
Conclusion
A cup and handle pattern earns a trade only after two checks. First, it must pass all five tests: prior rise, depth, shape and length, handle position, and breakout volume. Second, the risk-reward must still suit you at the adjusted target, not just the textbook one. A trade that only works at the full projection is weaker than it looks.
To build a watchlist, use the stock screener
to filter by exchange, market cap and sector, then study each chart on
TradingView. Write down your entry, stop-loss and both targets before you place the order, and leave them unchanged once live.