

A stock falls to ₹500, bounces, then sinks back to almost the same level and holds. That could be the start of a double bottom pattern, and buying the second bounce feels smart. Yet Thomas Bulkowski's research puts the risk plainly: if you buy before the pattern confirms, there is a 48% chance price keeps falling instead. Unlike most candlestick patterns, which form in a session or two, a double bottom can take weeks, making it a chart pattern.
What Is a Double Bottom Pattern?
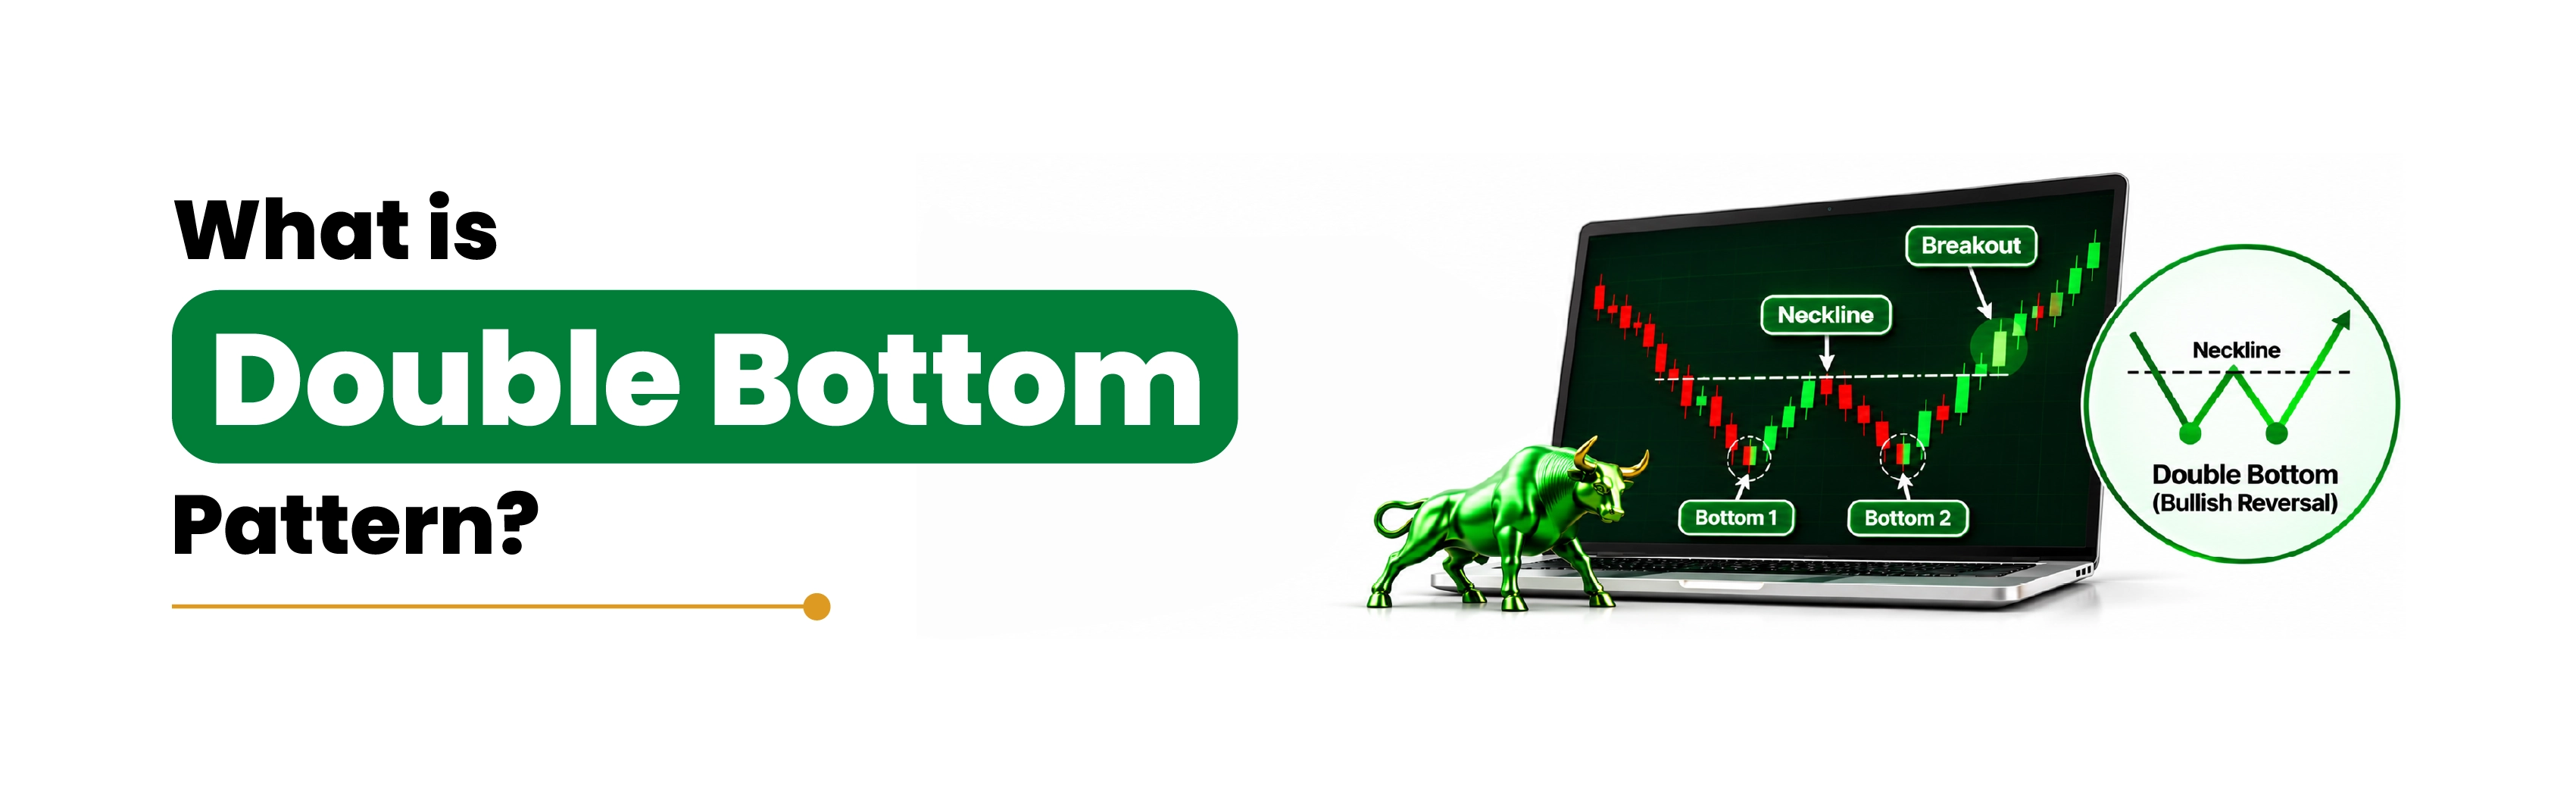
A double bottom is a bullish reversal pattern shaped like the letter W. It forms after a downtrend, when price hits a low, recovers, falls back to roughly the same low and then rises again.
It needs something to reverse. If the fall before the pattern is small, the rise after it is likely to be small too.
The key level is the neckline: the highest point between the two lows. The pattern is only complete when price closes above it.
Also Read: Understanding chart patterns becomes easier when you know the fundamentals of technical analysis in stock market and how traders interpret price movements.
How a Double Bottom Chart Pattern Forms
A double bottom chart pattern builds in four stages:
1. First low: heavy selling pushes the price down. Volume, the number of shares traded, is usually high here.
2. Recovery: buyers step in and lift the price. The top of this bounce becomes the neckline.
3. Second low: price falls again but holds near the first low. Volume is often lighter, a sign that sellers are tiring.
4. Breakout: price closes above the neckline, ideally with a jump in volume.
Reading these stages from the chart alone is the core of price action trading.
Also Read: To understand how price movements are represented visually, explore the Different Types of Charts Used in Technical Analysis and their applications in market analysis.
How to Confirm a Double Bottom
Check five things:
1. There was a clear downtrend before the first low.
2. The two lows are close in price, typically within a few percent of each other.
3. The lows are weeks apart, sometimes months.
4. Price rose by roughly 10% or more between the two lows.
5. Price has closed above the neckline, preferably on higher volume.
The fifth point is the trigger, and the 48% figure shows why. Volume and other technical indicators, such as moving averages, can add weight to the breakout.
How to Trade a Double Bottom: A Worked Example
Double bottom trading comes down to entry, stop-loss and target. A stop-loss is an order that exits a trade at a set price to limit the loss. Here is one hypothetical stock:
Item | Value |
Fall before the pattern | ₹640 to the first low |
First low | ₹500 |
Neckline (peak between the lows) | ₹560 |
Second low | ₹508 |
Entry: close above the neckline | ₹565 |
Stop-loss: just below the second low | ₹505 |
Pattern height (₹560 − ₹500) | ₹60 |
Target (neckline + height) | ₹620 |
Risk vs reward per share | ₹60 vs ₹55 |
The rise from ₹500 to ₹560 is 12%, and the second low sits 1.6% above the first, so the pattern passes the checklist.
Buying the Breakout
Entering at ₹565 with a stop at ₹505 risks ₹60 to aim for ₹55. That risk-reward ratio is below 1:1. The reward is smaller than the risk. This is the hidden cost of waiting for confirmation: you buy higher than the second low, so less of the move is left.
Buying the Retest
After the breakout, the old ceiling can become a floor, and the first pullback frequently tests it. Bulkowski calls a return to the breakout price within 30 days a throwback. Traders who wait for price to dip back towards ₹560 get a lower entry. Because the pattern unfolds over weeks, it is better suited to swing trading than to same-day trades. If price slips back below the neckline, expect a weaker move, as the data below shows.
Double Bottom vs Double Top
The double bottom has a bearish mirror image.
Feature | Double bottom | Double top |
Shape | W | M |
Trend before | Downtrend | Uptrend |
Signal | Bullish reversal | Bearish reversal |
Confirmation | Close above the neckline | Break below the neckline |
The double top pattern forms after a rise and warns that buying pressure may be fading.
Going Deeper: How Reliable Is the Double Bottom?
Bulkowski sorts double bottoms by the shape of each low: Adam bottoms are narrow and V-shaped, Eve bottoms are wide and rounded.
Type | Rank (of 39 patterns) | Target met | Break-even failure | Throwback |
Eve & Eve | 5 | 65% | 12% | 65% |
Adam & Adam | 26 | 73% | 16% | 67% |
A break-even failure means price rose less than 5% after the breakout. In Bulkowski's 1991 to 2005 study of 19 chart pattern types, patterns that held above the breakout during a throwback rose 40% on average. Those that fell below rose 29%.
The figures come from his own tests, last updated in 2025.
Before You Buy a Double Bottom
Ask four questions first:
1. Was there a real downtrend to reverse?
2. Are the two lows close in price and weeks apart?
3. Has price closed above the neckline?
4. Does the target justify the distance to your stop?
A double bottom is one tool within technical analysis, never the whole decision. You can practise spotting the W on TradingView charts on the Indiabulls Securities platform and place a Stop-Loss order before you enter. Wait for the neckline, then let the numbers decide.