

Most chart patterns warn that a trend is about to turn. A flag pattern says the opposite: the trend is only catching its breath. It forms when a sharp price move pauses in a small, tilted channel before it may resume in the same direction. Unlike candlestick patterns, which are read from one candle or a small group, a flag is built from many candles, so it counts as a chart pattern.
What Is a Flag Pattern in Trading?
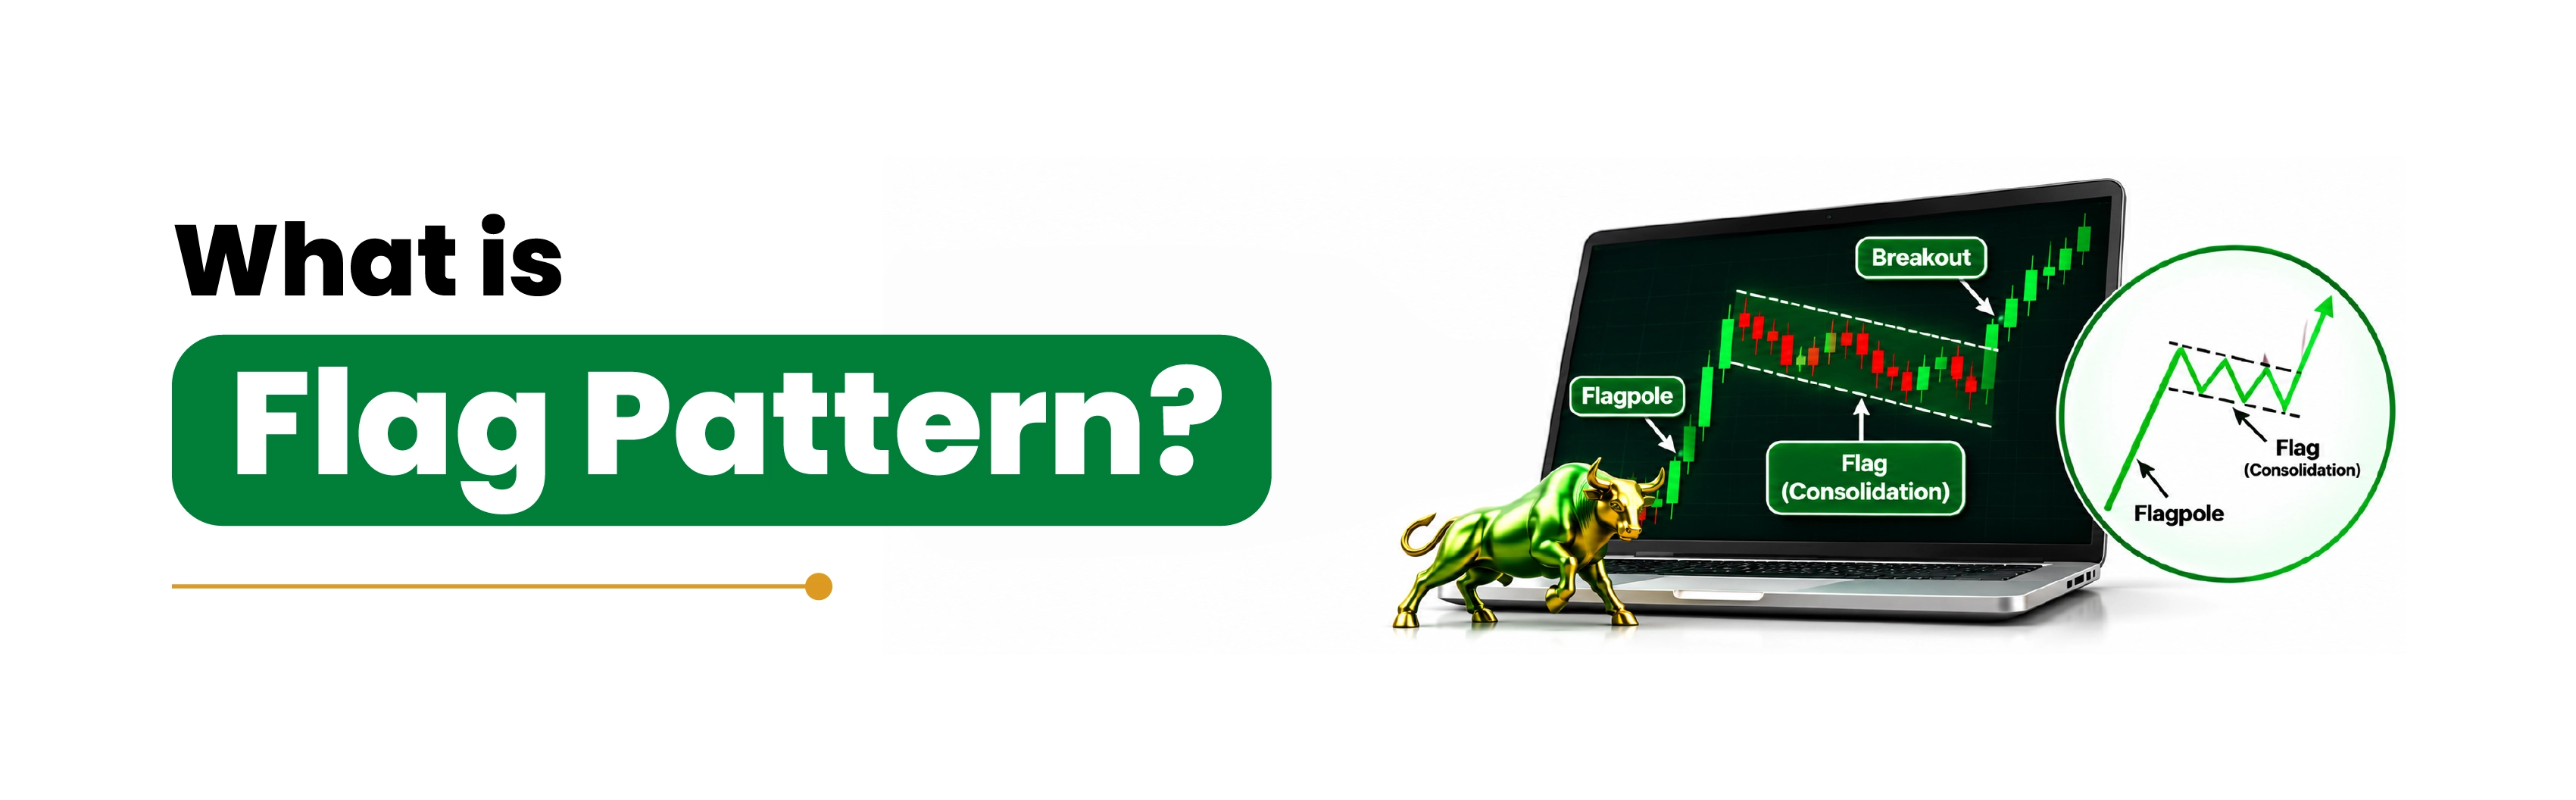
A flag pattern has three parts:
• Flagpole: a steep, fast move up or down, usually on heavy volume (the number of shares traded).
• Flag: a short pause where price moves between two parallel lines, tilted against the pole.
• Breakout: the moment price leaves the flag in the direction of the pole.
Those two lines are trendlines, drawn across the highs and lows of the pause. The flag usually lasts a few days to a few weeks. Traders call it a continuation pattern, since the original move is expected to resume. A double top pattern, by contrast, signals that a rise may be ending.
Also Read: To understand how traders evaluate price movements, trends and market behaviour, explore our guide to technical analysis in stock market.
Bull Flag vs Bear Flag: Key Differences
Flags come in two mirror-image forms.
Feature | Bull flag | Bear flag |
Move before the flag | Sharp rise | Sharp fall |
Flag slope | Flat or slightly down | Flat or slightly up |
Signal | Break above the upper line | Break below the lower line |
Stop-loss | Below the flag's low | Above the flag's high |
A stop-loss is an order that exits a trade at a set price to limit the loss.
How to Spot a Flag Pattern
Check five things before you call it a flag:
1. The pole is steep and covers several days of strong movement.
2. Volume is heavy during the pole.
3. Price stays inside two parallel lines during the flag.
4. Volume falls while the flag forms.
5. The breakout comes with a jump in volume.
This is price action trading in practice: reading buyers and sellers from the chart's shape. Tight flags tend to beat loose, jagged ones.
Also Read: To understand different chart formations and how they help traders interpret market movements, explore Stock Market Charts - Patterns and Insights.
How to Trade a Flag Pattern: Bull and Bear Examples
Flag pattern trading comes down to three numbers: entry, stop and target. The examples below use hypothetical prices.
Item | Bull flag | Bear flag |
Pole | ₹400 to ₹460 (₹60) | ₹600 to ₹540 (₹60) |
Flag range | Drifts down to a ₹445 low | Drifts up to a ₹556 high |
Entry on breakout | ₹455 | ₹545 |
Stop-loss | ₹444 | ₹557 |
Target (pole height) | ₹515 | ₹485 |
Risk vs reward per share | ₹11 vs ₹60 | ₹12 vs ₹60 |
Trading a Bull Flag
Price breaks above the upper line at ₹455. Adding the ₹60 pole gives a ₹515 target, and a stop at ₹444, just under the flag's low, risks ₹11 per share. That risk-reward ratio looks attractive. But the full target is missed more often than it is hit, so some traders set a nearer target where the stock stalled before.
Entries come in three styles: on the breakout, on a dip back to the breakout level, or early near the flag's lower line, which is riskiest. On daily charts, flags can suit swing trading, where positions are held for days or weeks.
Trading a Bear Flag in India
A bear flag trade means short selling: selling shares you do not own and buying them back later. SEBI's framework for short selling allows retail traders to do this, but shares sold must be delivered at settlement. Without borrowed shares, that means buying back the same day, which is intraday trading. Fail to deliver, and the exchange buys the shares at an auction that can cost more than your sale price.
Holding a short for longer usually means using futures and options. Their leverage, a small upfront payment controlling a much larger position, makes losses grow as fast as gains, and losses can exceed your capital.
Going Deeper: How Reliable Is the Flag Pattern?
Less reliable than its tidy shape suggests. In Thomas Bulkowski's tests (statistics as of August 2020), the pole-height target was reached only 46% of the time, for both bull and bear flags. About 44% of upward and 45% of downward breakouts were break-even failures: price moved less than 5% beyond the breakout.
Volume did follow the textbook: it fell inside the flag 74% of the time before upward breakouts and 77% before downward ones. Bulkowski also found that flags tilting against an uptrend did better.
Pennants, the triangle-shaped cousin, fared worse. Their targets were met only 35% of the time on upward breakouts and 32% on downward ones.
Before You Trade a Flag
Run through four questions first:
1. Was the pole steep and backed by volume?
2. Is the flag tight, between parallel lines?
3. Did volume rise on the breakout?
4. Is your stop set on the far side of the flag?
A flag is one tool within technical analysis, never the whole decision. You can practise spotting flags on TradingView charts on the Indiabulls Securities platform and place a Stop-Loss order with each trade. Plan for the stop first, because the target is the part a flag delivers less than half the time.