


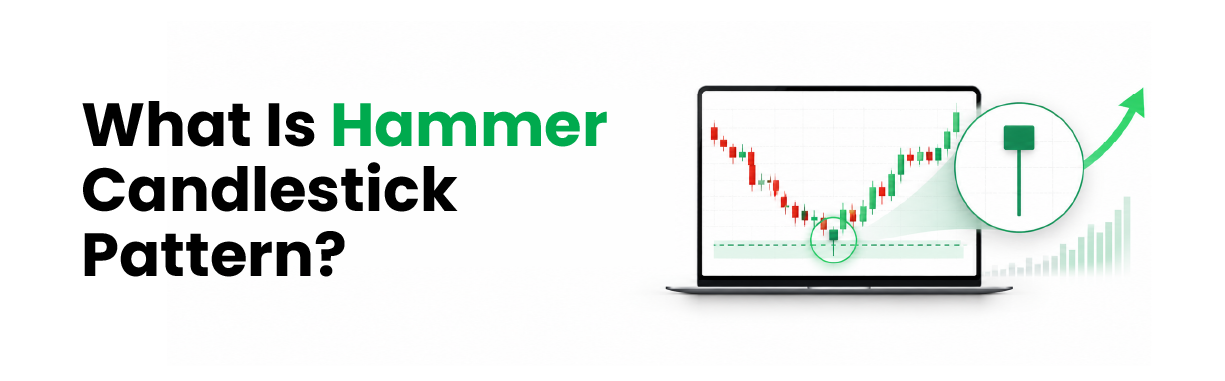
A hammer candlestick pattern is a single candle with a small body near the top and a long lower shadow, formed after a fall. In Thomas Bulkowski's tests, it acted as a bullish reversal only 60% of the time, barely better than a coin toss. In technical analysis, the context around a hammer decides whether it deserves your money at all.
What Is a Hammer Candlestick?
A hammer candlestick has a small real body near the top of its range. Its lower shadow, the thin line below the body, is at least twice the body's length. It has little or no upper shadow and must form after a decline.
Example stock: open ₹494, low ₹480, high ₹500, close ₹498.
Part | Rule | Example |
Real body (gap between open and close) | Small, near the top | ₹4 |
Lower shadow | At least 2 times the body | ₹14, or 3.5 times |
Upper shadow | Little or none | ₹2 |
Colour matters less; Bulkowski found white bodies did best. Like all candlestick patterns, it needs context.
What the Hammer Candle Means at the End of a Fall
The hammer candle means buyers won a fight that sellers started. Sellers pushed the example stock ₹14 below its open. That drop is the long lower shadow. Buyers absorbed the selling and lifted the close to ₹498, near the day's high.
Location turns the shape into a signal. After a run of lower closes, a hammer hints that selling is drying up. Bulkowski's best results came from hammers within a third of the yearly low. After a rally, the same shape is a hanging man, read as bearish.
Reading this tug of war is the heart of price action trading.
Hammer Pattern vs Look-Alike Candles
Mixing these up can flip a trade's meaning.
Candle | Shape | Appears after | Traditional reading |
Hammer | Small body on top, long lower shadow | A decline | Bullish reversal |
Hanging man | Same as the hammer | A rally | Bearish reversal |
Inverted hammer | Small body at the bottom, long upper shadow | A decline | Bullish reversal, needs firmer confirmation |
Dragonfly Doji | Almost no body, long lower shadow | A decline | Bullish reversal |
These are textbook readings, not tested odds. In Bulkowski's tests, the hanging man was followed by further gains 59% of the time. Read the shape to name the candle, then read the trend before it.
Also Read: Explore Top 10 Candlestick Patterns Every Trader Should Know to understand other common candle formations and their traditional interpretations.
How to Trade a Hammer Candlestick Pattern: A Worked Example
The usual rule in swing trading (holding for a few days to a couple of weeks) is to wait for the next candle to close above the hammer's high.
Step | Level | Reason |
Entry | ₹504 | Closes above the ₹500 high |
Stop-loss (automatic exit order) | ₹479 | Below the ₹480 low; ₹25 risk per share |
Size | 80 shares (₹40,320) | ₹2,000 loss cap, 1% of ₹2,00,000 |
The stop sets the size: basic risk management in trading.
At Indiabulls Securities' rates (as on October 2026), a stopped-out trade costs ₹2,000 plus about ₹114 in charges, excluding depository charges.
Only ₹22 is brokerage, at 2.5% or ₹11 per executed order, whichever is lower, on NSE (CM, FO, CD), BSE (CM, FO) and MCX. STT (Securities Transaction Tax), 0.1% a side, takes ₹78.64: the tax costs more than the broker. Test yours in the brokerage calculator.
Bulkowski's target, the candle's ₹20 height added to its top, gives ₹520, hit 88% of the time in his best case, a rising market. That is ₹16 of reward for ₹25 of risk, so you need resistance (a zone where buying has stalled) above ₹529.
When a Hammer Fails
A hammer fails when price closes below its low; that is where the stop sits. It fails more often in sideways markets and around company news. Even working hammers move modestly: Bulkowski ranks their overall performance 65th of 103 candle types. Volume and RSI (Relative Strength Index) are common technical indicators for confirmation.
Going Deeper: When Is a Daily Hammer Final on NSE?
Since 3 August 2026, stocks with futures and options (F&O) contracts stop continuous trading at 3:15 PM. Their official close comes from a Closing Auction Session (CAS) ending at 3:35 PM. Other stocks still close at the volume-weighted average price of the last 30 minutes.
A 3:10 PM hammer can vanish by 3:35 PM, so judge it after the close.
Conclusion
Run four checks before acting on a hammer. Shape: a small body on top and a long lower shadow. Location: after a clear decline. Confirmation: a later close above its high, on the official close. Risk: a stop under the low, a sized position and charges counted.
If all four line up, plan it on the charts in your equity trading account, with the stop-loss placed on entry. If any one fails, skipping the trade costs you nothing, not even STT.