

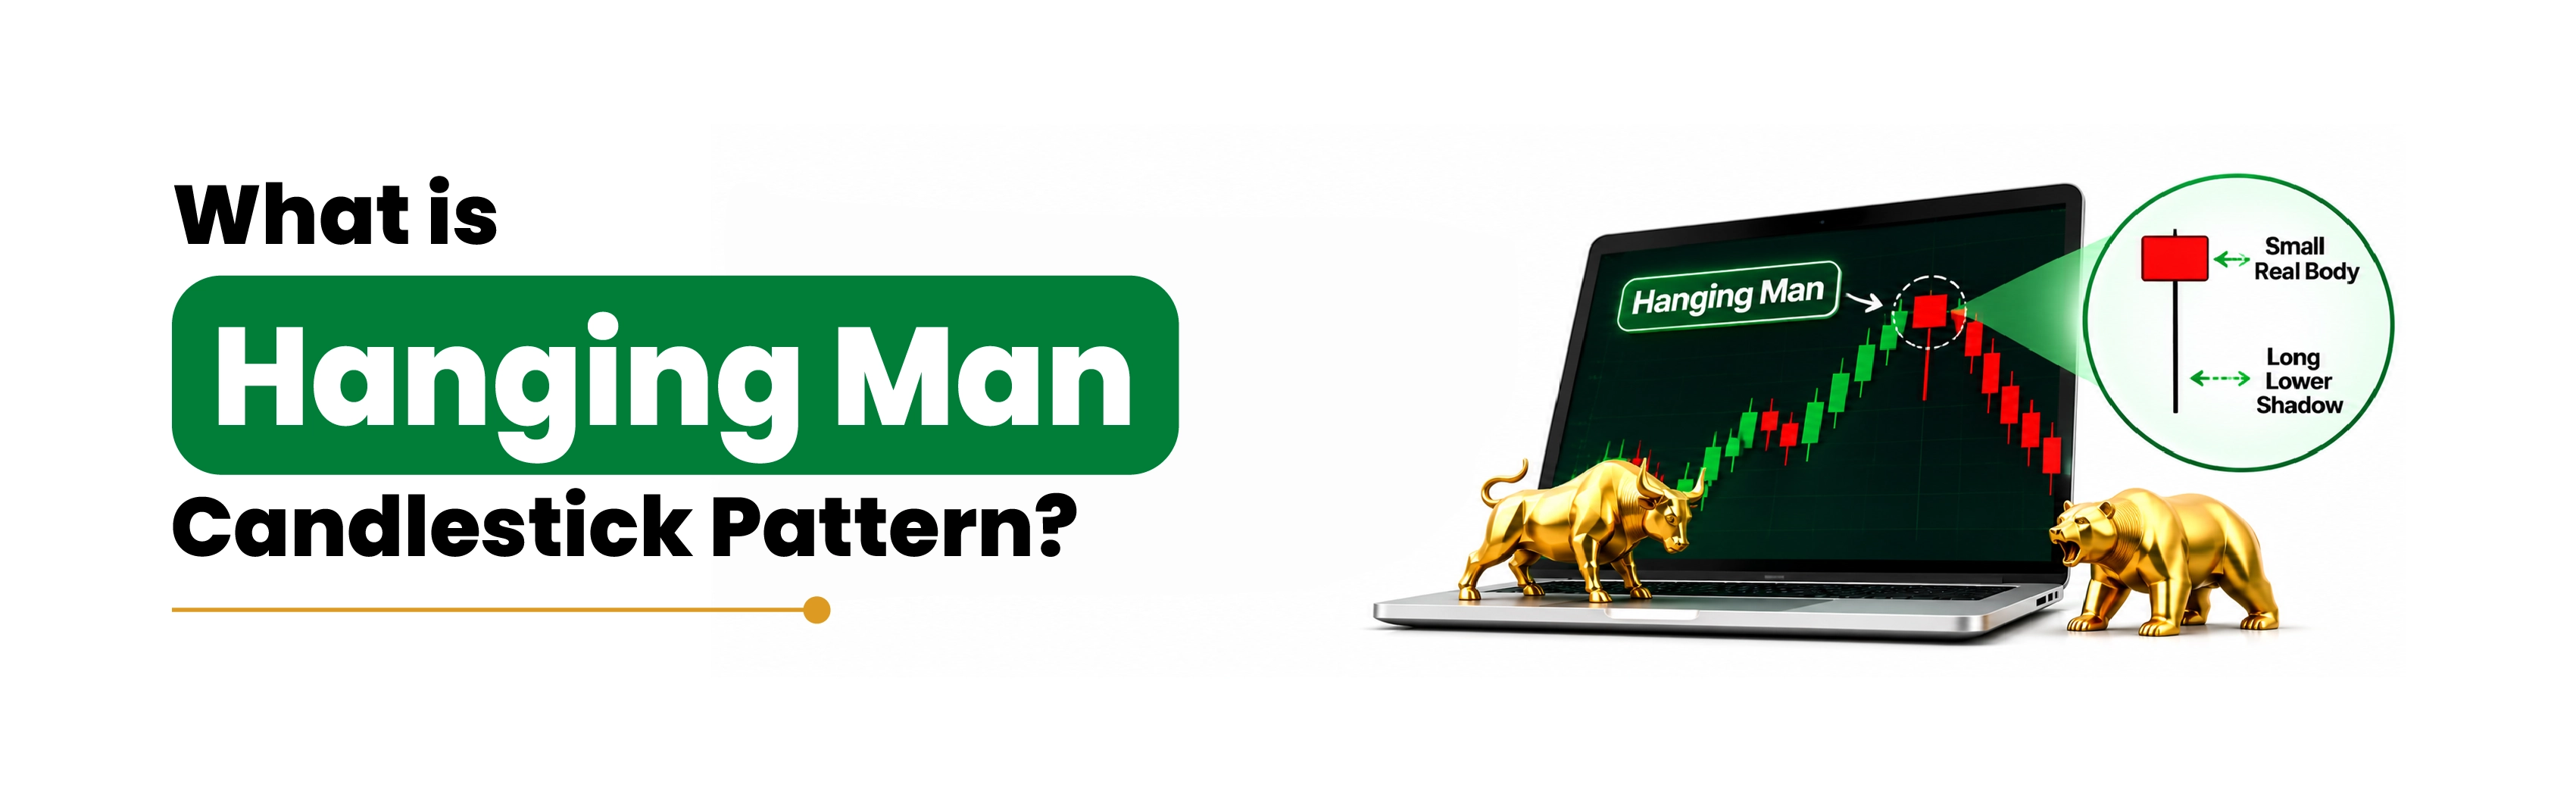
In Thomas Bulkowski's tests, price broke upward after a hanging man 59% of the time, even though the textbook calls it bearish. So what is the hanging man pattern? A single candle that forms after a rise, with a small body near the top and a long lower shadow. It warns that buying may be fading, which makes it something to check, not a signal to sell.
What Is a Hanging Man Candlestick?
A candlestick shows one period of trading. The body spans the open and close; the thin lines above and below, called shadows or wicks, mark the high and low.
A hanging man candlestick has:
• A small body near the top of the day's range.
• A long lower shadow.
• Little or no upper shadow.
It must appear after an uptrend, a run of rising prices. The same shape after a fall is called a hammer and reads as bullish. Like most candlestick patterns, the hanging man takes its meaning from where it forms.
Also Read: To understand other commonly used chart formations, explore the Top 10 Candlestick Patterns Every Trader Must Know and learn how different patterns can help interpret market movements.
How Do You Identify a Hanging Man Pattern?
Run four checks:
1. The price was in a clear uptrend before the candle.
2. The lower shadow is at least twice the length of the body.
3. The upper shadow is small or absent.
4. The body sits in the upper part of the day's range.
A hypothetical candle after a rally:
Item | Value |
Open | ₹500.00 |
High | ₹500.50 |
Low | ₹488.00 |
Close | ₹499.00 |
Body | ₹1.00 |
Lower shadow | ₹11.00 |
Upper shadow | ₹0.50 |
The lower shadow is 11 times the body, the upper shadow is just ₹0.50, and the body sits near the top of a ₹12.50 range. With the prior rally, it passes all four checks. It is a valid hanging man, but not yet a trade.
What Does the Hanging Man Pattern Tell You?
The candle records a fight inside one session. Buyers controlled the rally. Then sellers pushed the price sharply lower, ₹12 below the open. Buyers won most of it back by the close. Still, the long shadow shows sellers can now push hard near the top.
That is the core idea of price action trading: the candle's shape shows who controlled the session.
Also Read: To understand how traders analyse price movements, trends and chart patterns, learn more about technical analysis in stock trading.
Hanging Man vs Hammer vs Shooting Star: What Is the Difference?
Three candles look similar. The prior trend and the position of the long shadow tell them apart.
Candle | Trend before | Long shadow | Possible meaning |
Hanging man | Uptrend | Lower | Bearish turn |
Hammer | Downtrend | Lower | Bullish turn |
Shooting star | Uptrend | Upper | Bearish turn |
Inverted hammer | Downtrend | Upper | Bullish turn |
How Do Traders Use the Hanging Man Pattern?
Wait for confirmation: a next candle that shows sellers in control. In the example, a falling candle that closes below ₹499 confirms it. So does a gap down: a next candle that opens below ₹499 and closes lower. Cautious traders act after that close; aggressive traders act once the next candle trades below the hanging man.
A stop-loss is an order that exits a trade at a set price to cap the loss. For a bearish trade, it usually sits just above the high, ₹500.50 here, because a move above it suggests the uptrend is intact. Weigh that stop against your target with the risk-reward ratio.
Already hold the stock? Then the pattern is a cue to review your stop-loss, not an automatic sell.
Betting on a fall means short selling: selling shares you do not own and buying them back later. SEBI's framework for short selling allows retail traders to do this, but shares sold must be delivered at settlement. Without borrowed shares, that means buying back before the close, which is intraday trading. Fail to deliver, and the exchange buys the shares at an auction that can cost more than your sale price.
Holding a short for longer usually means using futures and options. Their leverage, a small upfront payment controlling a much larger position, makes losses grow as fast as gains, and losses can exceed your capital.
Going Deeper: How Reliable Is the Hanging Man Candlestick Pattern?
On its own, not very. In Bulkowski's tests, the pattern led to an upward breakout 59% of the time. It ranked 87 out of 103 candlestick patterns for overall performance. He described the breakout direction as almost random.
So look for supporting evidence. A hanging man on above-average volume may carry more weight, but volume alone does not confirm it. Many traders also check technical indicators. The Simple Moving Average (SMA) is the average closing price over a set number of days. The Relative Strength Index (RSI) measures the speed and size of recent price moves.
Before You Act on a Hanging Man
Before any trade, ask:
1. Is there a clear uptrend?
2. Does the candle pass the shape test?
3. Has the next candle confirmed it?
4. Is your stop-loss set above the high?
The pattern is one tool within technical analysis, never the whole decision. You can practise spotting it on TradingView charts on the Indiabulls Securities platform and protect each trade with a stop-loss order. Treat every hanging man as a question the next candle has to answer.