


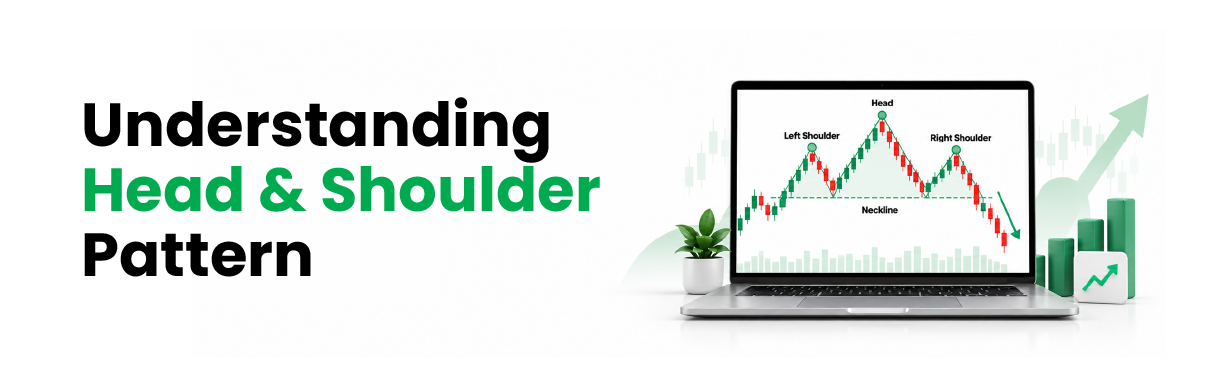
A head and shoulder pattern is a three-peak chart formation that can mark the end of an uptrend. Its middle peak, the head, stands above two lower shoulders. It is a staple of technical analysis. Yet in Thomas Bulkowski's US stock data (statistics updated August
2020), only 51% of confirmed patterns reached their textbook target. So learn the pattern, but question the target.
What Is Head and Shoulder Pattern?
The pattern forms after a sustained rise and has four parts.
Part | What happens | What it suggests |
Left shoulder | Price peaks, then dips | The uptrend looks intact |
Head | A higher peak, then a fall near the earlier low | Buyers could not hold the high |
Right shoulder | A rally that stops below the head | Buying is fading |
Neckline | A line joining the two lows | The level that must break |
Unlike candlestick patterns, which are read from one or a few candles, this chart pattern builds over many sessions. Its three peaks also separate it from the double top pattern, which has two peaks at roughly the same price.
Also Read: To understand how different chart formats help traders interpret price movements, explore the Types of Charts in Technical
Analysis.
Chart Pattern Head and Shoulders: Signs That Confirm It
The shape alone proves nothing.
Three checks separate a real pattern from random bumps.
• Volume fades: heaviest on the left shoulder or head, lighter on the right shoulder.
• Price closes below the neckline: a dip during the session that recovers does not count.
• A downward-sloping neckline: a close below the right armpit, the low before the right shoulder, confirms it.
Fading volume matters because fewer buyers are joining each rally. Bulkowski's own advice is to wait for confirmation before placing a trade.
Moving averages and other technical indicators can add a second opinion, since no single signal settles the question.
How to Trade the Head and Shoulder Pattern: A Worked Example
In this hypothetical case, a stock peaks at ₹520 (left shoulder), ₹560 (head) and ₹522 (right shoulder).
Both lows sit near ₹480. It then closes at ₹476, below the ₹480 neckline.
The head is ₹80 above the neckline, so the textbook target is ₹400. Bulkowski suggests a conservative version: multiply the height by the share of patterns that reach their target (51%). That gives about ₹41, or a target near ₹439.
Then set a stop-loss, your exit price if the trade fails. From a ₹476 entry:
Stop-loss at | Risk per share | Reward to ₹439 | Reward to ₹400 |
₹495, above neckline | ₹19 | ₹37 (about 2:1) | ₹76 (4:1) |
₹525, above right shoulder | ₹49 | ₹37 (about 0.8:1) | ₹76 (about 1.6:1) |
₹562, above head | ₹86 | ₹37 (about 0.4:1) | ₹76 (about 0.9:1) |
No row is a clear winner. A stop above the head absorbs noise but leaves a poor risk-reward ratio. The neckline stop looks best on paper. Yet in Bulkowski's data, price returned to the breakout level within 30 days in 68% of cases. A close stop can be hit even when the pattern works.
Acting on a Breakdown in India: Holders and Short Sellers
If you own the stock, a confirmed breakdown is a reason to review the position, not an instruction to sell.
Profiting from a fall means short selling, which SEBI defines as selling shares you do not own at the time of the trade. As on December 2025, every seller must deliver shares at settlement. A cash-segment short sale is therefore intraday trading: you buy back the same day. The exception is borrowing shares through the Securities
Lending and Borrowing (SLB) scheme.
Miss the same-day buyback and the shares go to auction. If the auction fails, NSE Clearing closes out the trade. You pay the higher of the highest price since the trade day or 20% above the auction day's official close.
Holding a bearish view overnight usually means derivative trading in futures or options, contracts whose value is derived from the share price. Losses on these can exceed the capital you put in.
When the H&S Pattern Fails
Planning for failure is part of using the h&s pattern. In Bulkowski's US stock data (updated August 2020):
• 19% failed to fall even 5%, too little to cover trading costs.
• About 32% busted: price fell 10% or less, then closed above the head.
The early warning is price climbing back above the neckline.
A 1998 Federal Reserve Bank of New York study by Carol Osler is more sceptical. Pattern traders in US equities did not trade profitably, and the price effect faded within two weeks. None of this data is Indian, so treat the pattern as one input, not a verdict.
Conclusion
The pattern gives you defined levels: a neckline to confirm, a height to measure and a shoulder to set risk against. Its weak point is the target, reached about half the time in
Bulkowski's data.
Before acting, mark the neckline with the drawing tools on Indiabulls Securities charts and work out both targets. Then price your stop-loss in rupees. If the numbers do not justify the risk, there is no trade.