

The third green candle of a Morning Star pattern looks like a buy signal, and many guides treat it as one. Pattern researcher Thomas Bulkowski sets a stricter bar. On US stocks, the pattern led to an upward breakout 78% of the time. He counts a breakout only when price closes above the top of all three candles. Until that close, the pattern is only evidence.
What Is the Morning Star Pattern?
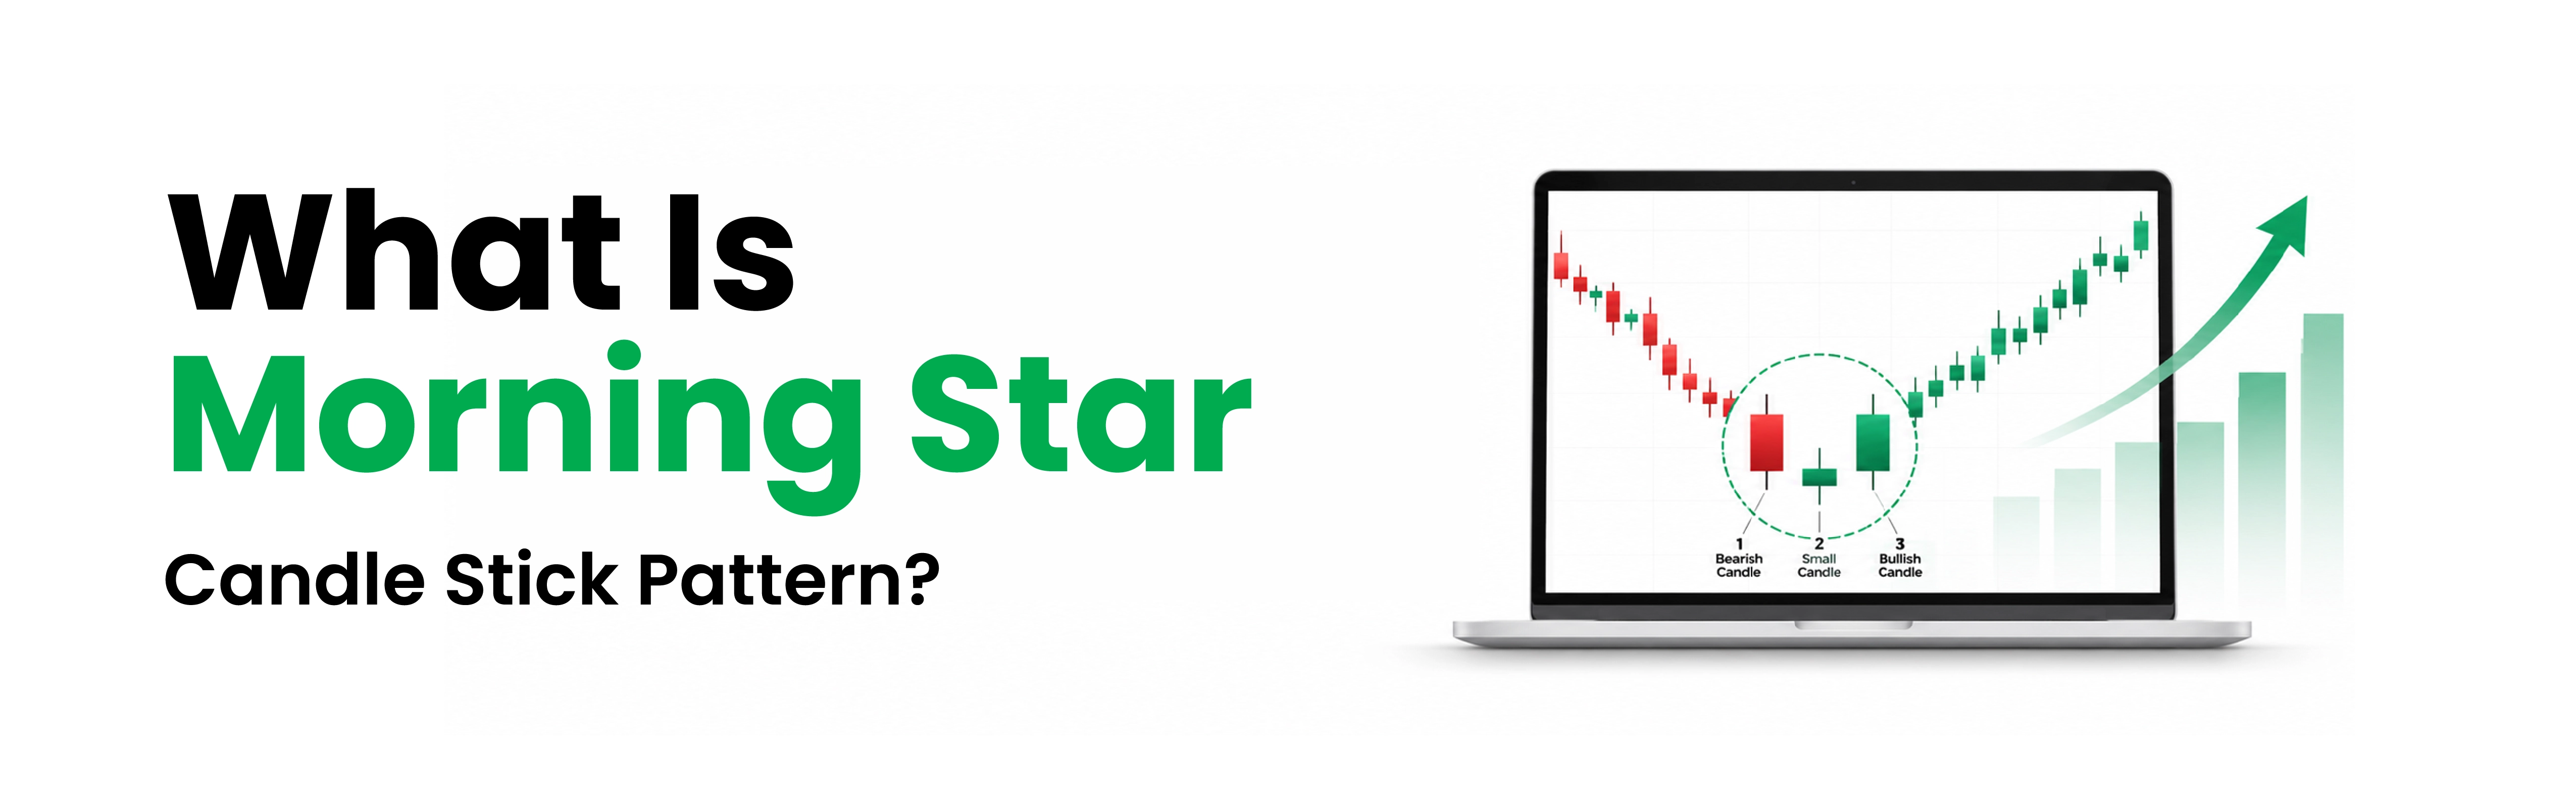
A Morning Star is a three-candle bullish reversal that forms after a decline. A candle's body is the range between its open and close. A gap means a body opens clear of the previous one.
Candle | What it looks like | What it tells you |
1 | Long red body extending the fall | Sellers are in control |
2 (the star) | Small body of any colour, gapping below candle 1's body | Selling has stalled |
3 | Long green body, gapping up and closing at least halfway into candle 1's body | Buyers have won back much of the fall |
Unlike single-candle candlestick patterns, it needs all three sessions.
How Do You Identify a Morning Star Candlestick?
A Morning Star candlestick must pass three tests:
• A clear decline comes first.
• The star's body sits below the first candle's body.
• The third candle closes at least halfway into the first candle's body.
In an illustrative stock, candle 1 opens at ₹540 and closes at ₹500, so its midpoint is ₹520. The star opens at ₹495 and closes at ₹493, so its body sits below ₹500. Candle 3 opens at ₹498 and closes at ₹527, so the pattern passes.
Bulkowski found the pattern performed best within a third of the yearly low. Heavier volume on candle 3, or a Relative Strength Index (RSI) climbing back above 30 on its 0 to 100 scale, suggests buyers mean it. Both are common technical indicators of confirmation.
Also Read: To understand the broader principles behind chart-based trading decisions, explore What is Technical Analysis and its Important?.
How Do You Trade the Morning Star Candlestick Pattern?
Trading the Morning Star candlestick pattern comes down to one choice: enter early, or wait for the breakout. The pattern's top is candle 1's ₹543 high. A stop-loss, an order that exits if price falls to a set level, sits at ₹487, just under the star's low. Both entries risk about ₹5,000 before charges.
Early entry | Confirmed entry | |
Trigger | Above candle 3's ₹530 high | A close above the ₹543 top |
Buy price | ₹531 | ₹544 |
Risk per share | ₹44 | ₹57 |
Shares | 113 | 87 |
Position size | ₹60,003 | ₹47,328 |
Confirmation costs ₹13 a share and 26 fewer shares. That is the price of buying the move Bulkowski's 78% measures, not hoping for it.
A fixed risk-reward ratio such as 1:2 is a common exit target. Bulkowski, however, found gains after an upward breakout start slowly, then build. A trailing stop, raised as price climbs, gives the trade time.
How Reliable Is the Morning Star, and When Does It Fail?
Bulkowski ranked the Morning Star 6th of 103 candle patterns for reversal reliability and 12th for overall performance.
Three limits apply. The data covers US stocks, not NSE listings. Finding one takes a deliberate search (frequency rank 66). Failures can be sharp: in bear markets, downward breakouts averaged an 8.53% fall 10 days after the breakout, though from only 108 cases.
A close below the star's low cancels the pattern, so the stop belongs there. Keeping each failure affordable is the core of risk management in trading.
Going deeper: do the gaps hold on Indian intraday charts?
On daily charts, NSE sets each day's open through a pre-open call auction that matches orders at a single price. Overnight news can therefore push the next body clear of the last one.
Intraday candles rarely get that chance, because each one opens at the first trade after the previous candle closed. Relax the gap rule on a 15-minute chart and you are trading a looser pattern that Bulkowski's daily figures do not describe.
How Is It Different from a Morning Doji Star and an Evening Star?
The Morning Star has a close cousin and a mirror image.
Pattern | Middle candle | Forms after | Signal | Bulkowski's tested reliability |
Morning Star | Small body | A decline | Bullish reversal | 78% |
Morning Doji Star | Doji (open and close almost equal) | A decline | Bullish reversal | 76%, from 932 cases |
Evening Star | Small body | A rally | Bearish reversal | 72% |
The Doji version is rarer, ranking 78th for frequency against 66th. The Evening Star is the same shape upside down. Seeing one on a stock you hold is a reason to review your stop.
Conclusion
A Morning Star earns a trade only when four answers line up. Did a real decline come first? Did candle 3 close at or above candle 1's midpoint? Has price closed above the pattern's top, or are you entering early at extra risk? Is your stop under the star, with one loss affordable?
Run the buy and sell through the brokerage calculator for your full charges. Then mark both levels on the TradingView charts Indiabulls Securities offers, and place a stop-loss order at your chosen level.