



Look at the peer comparison table in the SRIT India IPO prospectus and one number jumps out. SRIT reports a return on net worth of 30.23%. The best of the five listed peers it names manages 16.25%.
On the same page, at the ₹130 upper band, SRIT works out to roughly 14 times trailing earnings. Four of those five peers trade higher.
The highest return in the group and nearly the lowest multiple. That combination should make you curious rather than comfortable, and the prospectus contains the explanation. It is in the cash flow statement.
All figures below are from the Red Herring Prospectus dated 22 September 2026. The RHP reports in ₹ million; amounts here are converted to crore.
What the SRIT India IPO is
The issue is ₹218.40 crore, made up entirely of a fresh issue of 1.68 crore shares. There is no offer for sale, so every rupee raised goes to the company and no promoter is selling a share.
The price band is ₹123 to ₹130 on a face value of ₹5. One lot is 115 shares, so the minimum application is ₹14,950 at the upper band. Bidding runs from 28 to 30 September 2026, allotment is expected on 1 October, and listing is scheduled for 6 October on BSE and NSE.
SRIT India was incorporated in September 1999 and is headquartered in Bengaluru. It runs three verticals: healthcare, electronic governance, and telecommunications and broadband. As of 30 June 2026 it had 177 permanent employees, seven contract-specific employees and 107 consultants.
One number from the risk factors shapes everything that follows. Government clients accounted for 89.41% of revenue in FY26, 91.34% in FY25 and 81.84% in FY24.
How SRIT compares with the peers it chose
The RHP names five listed comparables and prices them on their 17 September 2026 closes.
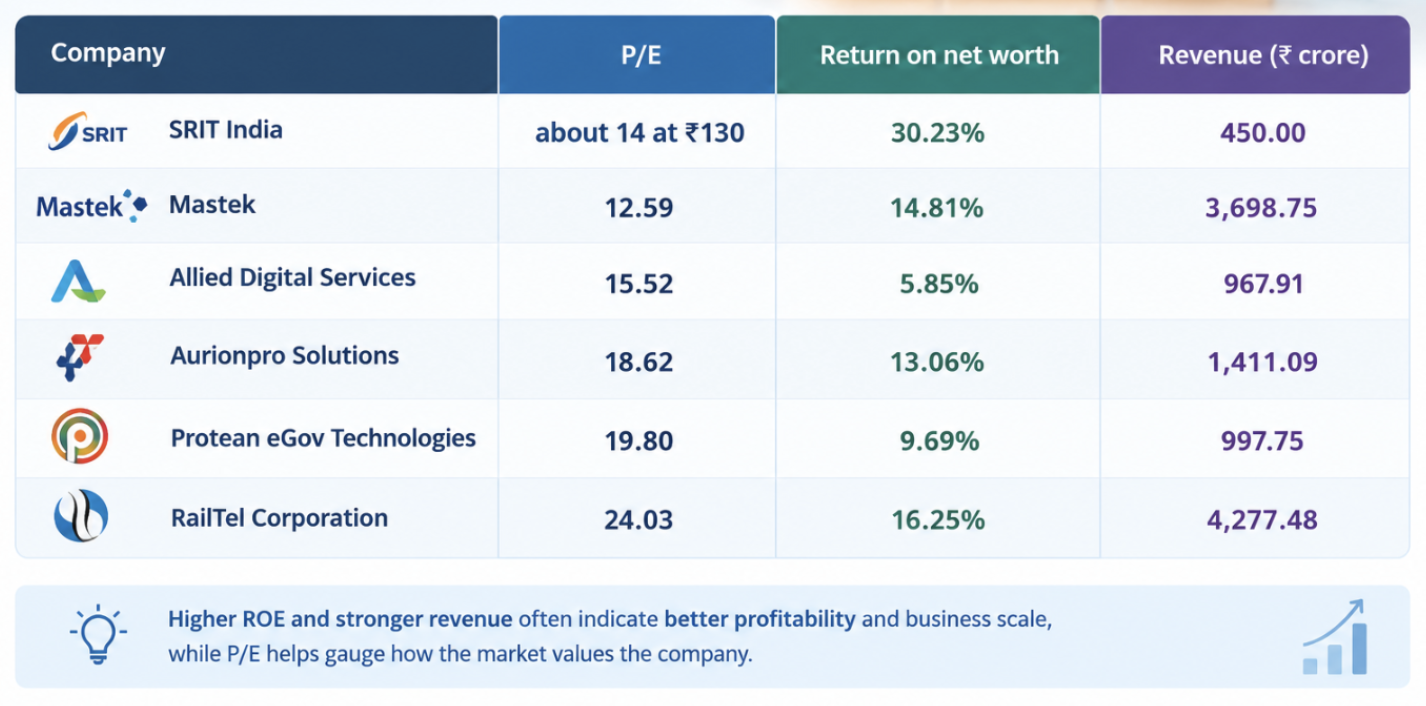
On the face of it, SRIT earns twice the return of its best peer and costs less than most of them.
Two qualifications belong right here. The 30.23% is the lowest of SRIT's last three years, not the highest: return on net worth was 44.11% in FY24 and 38.76% in FY25. The trend is down roughly 14 percentage points in two years, and the peer table shows only the last point on that line.
The second qualification is the multiple itself, and it needs its own section.
The cash flow statement tells a different story
Revenue and profit have both grown. Revenue from operations went from ₹271.09 crore in FY24 to ₹389.35 crore in FY25 to ₹450.00 crore in FY26. Profit after tax rose from ₹29.08 crore to ₹33.60 crore to ₹43.29 crore.
Now the same three years on the cash flow statement. Net cash from operating activities was ₹34.16 crore in FY24, ₹17.97 crore in FY25, and minus ₹12.10 crore in FY26.
Profit rose in every one of those years. Operating cash flow fell in every one of them, and in the most recent year it went below zero.
The RHP shows where it went. Before working capital movements, FY26 operations generated ₹66.62 crore. Working capital then absorbed ₹68.64 crore. The largest single line is "changes in other assets", which took ₹63.42 crore in FY26 after ₹58.94 crore in FY25.
This is what selling to government looks like on a balance sheet. The RHP recognizes a significant financing component on trade receivables. That is the accounting treatment used when customers pay so far in the future that the amount has to be discounted. It produced ₹7.15 crore of notional interest income in FY26. Money owed for more than a year is not an accident in this business. It is the business.
None of this makes the profit unreal. It means the profit is an accrual that has not yet become cash, and the gap has widened for three years running.
Why the share count matters more than usual here
Earnings per share went from ₹5.39 in FY24 to ₹7.20 in FY25 to ₹9.47 in FY26. That is growth of about 76% in two years.
Profit after tax over the same two years grew about 49%.
The difference is the share count. The weighted average number of shares fell from 5.39 crore in FY24 to 4.67 crore in FY25 to 4.57 crore in FY26, helped by a ₹20.78 crore buyback during FY25. Roughly a third of the EPS growth came from having fewer shares, not from earning more.
The issue now moves in the opposite direction. Adding 1.68 crore new shares to about 4.57 crore existing ones expands the count by roughly 37%.
Run FY26 profit across the post-issue share count and earnings per share works out near ₹6.92 rather than ₹9.47. At ₹130 that is about 19 times earnings, not 14.
That matters because the peer multiples in the table are calculated on those companies' actual share counts. Compared on the same basis, SRIT sits close to Aurionpro at 18.62 and Protean at 19.80, near the middle of its peer group rather than near the bottom.
The company will also have the issue proceeds working for it, which the FY26 profit figure does not reflect. The point is not that 19 times is the right number. It is that 14 times is not the comparable one.
Where the money goes
The RHP splits the proceeds three ways.
Capital expenditure on modernising and redeveloping existing products takes ₹12.86 crore, spread across FY27 and FY28.
Working capital takes ₹124.00 crore, with ₹80.60 crore planned for FY27 and ₹43.40 crore for FY28. Set that against the ₹122.36 crore that "changes in other assets" has absorbed across FY25 and FY26 combined. The working capital raise is close to the size of the hole that working capital has dug over two years.
The third object is inorganic growth through unidentified acquisitions, plus general corporate purposes. The RHP is explicit that no target has been identified and no definitive agreement signed. Together these are capped at 35% of gross proceeds, with acquisitions alone capped at 25% and general corporate purposes at 25%.
So up to a quarter of what you subscribe for may be spent on a company nobody has named yet. That is permitted, disclosed and common. It is also worth knowing before you bid rather than after.
One last disclosure. The weighted average cost of all shares transacted by the promoters and promoter group was ₹33.38 over the last three years. Over the last 18 months it was ₹66.22, against a ₹130 cap price. SEBI requires this precisely so you can see the distance.
