


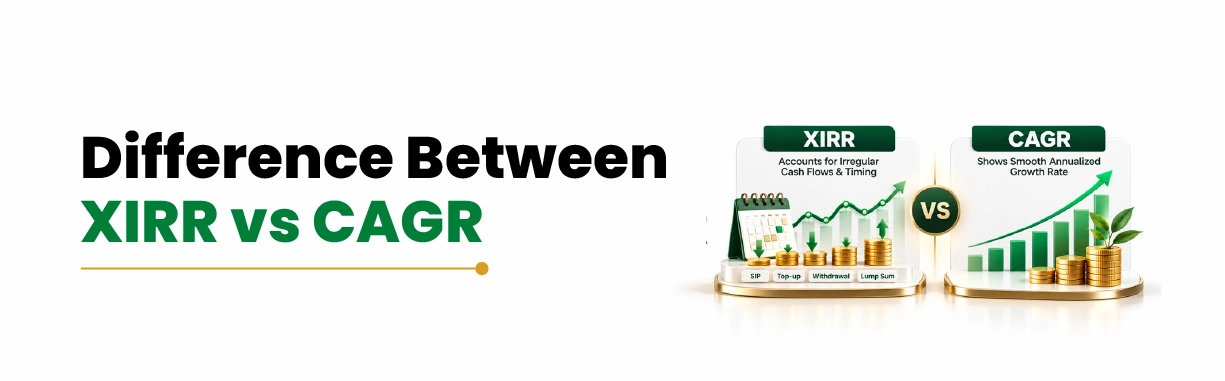
The same ₹1,80,000, invested month by month, can show a 6.9% annual return or a 13.4% annual return. Only the formula differs. That is the core of the XIRR vs CAGR question.
Use XIRR (extended internal rate of return) when money goes in or comes out on different dates. Use CAGR
(compound annual growth rate) when you invest once and redeem once, and in that case the two agree.
If you invest through a systematic investment plan (SIP), this choice decides whether your return looks weak or healthy.
What XIRR and CAGR Actually Measure
Both turn a gain into a yearly percentage, known as an annualised return. They differ in what they assume about when your money went in.
CAGR: One Start Value, One End Value
CAGR is the steady yearly rate that takes a starting value to an ending value. The formula is (Ending value ÷
Starting value)^(1 ÷ Years) - 1. It needs only two values, which is why it suits a single investment. Its use in goal setting is covered under CAGR in financial planning.
XIRR: Every Rupee on Its Own Date
XIRR handles many cash flows. A
cash flow is any money going in or out, such as an SIP instalment.
XIRR finds the one yearly rate that, applied to each instalment from its own date, adds up to your current value. Excel solves it by trial and error; many investing apps calculate it for you. For a full walkthrough, read about XIRR
in mutual funds.
XIRR vs CAGR on the Same SIP: A Worked Example
Take an illustrative SIP of
₹5,000 on the 5th of each month, from 5 January 2023 to 5 December 2025. That makes 36 instalments, or ₹1,80,000. Assume it is worth ₹2,20,000 on 5 January
2026.
Metric | What it assumes | Result |
Absolute return (total gain as % of investment) | Time does not matter | 22.2% |
CAGR | All ₹1,80,000 invested on 5 January 2023 | 6.9% a year |
XIRR | Each ₹5,000 invested on its actual date | 13.4% a year |
Why the gap? CAGR treats the full ₹1,80,000 as if it worked for three years. Yet the last instalment was invested for one month, and the average rupee for about 1.54 years. CAGR
spreads the gain over too long a period, so it understates the return. Read that way, a healthy SIP looks like a poor one.
Now take a lump sum of ₹1,00,000 on 5 January 2023 that grows to ₹1,50,000 by 5 January 2026. CAGR is 14.47% and
XIRR is 14.46%. The tiny gap comes from the 2024 leap day. With one investment, the two agree.
These figures are illustrative and do not indicate the returns of any fund or category.
To understand how periodic investments contribute to your portfolio, explore mutual fund investments and learn more about the available investment options.
Difference Between XIRR and CAGR
The example points to six differences.
Point | CAGR | XIRR |
Question it answers | How fast did one sum grow yearly? | What yearly return did all my money earn? |
Inputs | Start value, end value, years | Every amount and date, plus current value |
Timing of instalments | Ignored | Counted to the day |
Where you usually see it | Fund factsheets | Investing apps and portfolio trackers |
Best suited for | One lump sum held over a year | SIPs, top-ups and withdrawals |
Easy by hand? | Yes | No, use Excel or an app |
For SIP investors, timing matters most. It alone explains the gap in the worked example.
Why Your SIP Return Differs From the Fund's Published Return
Your SIP return often differs from the figure on the mutual fund factsheet. Neither number is wrong.
When mutual funds advertise scheme performance, SEBI's norms require it as CAGR for the past 1, 3 and 5 years, and since inception. Factsheets typically state that returns above one year are CAGR. That figure assumes one investment at the start of each period.
Your SIP started on your own date. Each instalment also bought units at a different NAV (net asset value, the price of one unit). So compare funds using factsheet CAGR, and judge your own money using XIRR.
CAGR vs XIRR: Which One Should You Use?
Let the way you invested decide.
Your situation | Metric to use |
One lump sum, held over a year | CAGR (XIRR matches it) |
SIP running over a year | XIRR |
Lump sum plus top-ups or withdrawals | XIRR |
Comparing two funds, same period | Factsheet CAGR |
Holding under one year | Absolute return, not annualised |
In Excel, list dates and amounts in two columns, with investments as negatives and today's value as positive.
Then use =XIRR(values, dates).
For a lump sum, the CAGR
calculator from Indiabulls Securities does the maths. If you are still weighing SIP
vs lump sum, that choice also sets which return figure you will track.
Common Mistakes When Reading XIRR and CAGR
Each of these turns a correct number into a wrong conclusion.
•
Running CAGR on SIP totals: in the example, it cut
13.4% to 6.9%.
• Comparing your XIRR with a factsheet CAGR: one uses your dates, the other one start date.
• Annualising short holdings: a 5% gain in two months can look like 30% or more once annualised.
• Reading either number as a forecast: both measure the past, and returns can turn negative.
Keep them in mind when you evaluate your mutual fund portfolio, so each holding is judged fairly. Mutual fund returns move with the market and are not fixed.
Conclusion: Match the Metric to How You Invested
Use CAGR when one investment meets one end value, and XIRR when several dated investments or withdrawals are involved. For holdings under a year, stick to absolute returns, because annualising them misleads.
Next, run XIRR on your own SIP
transaction dates to see your real yearly return. To compare funds, line up their factsheet CAGRs for the same periods using the mutual fund scheme comparison tool on Indiabulls Securities. Past returns describe what happened and do not predict future performance.