


Home
Charts For Traders
Trade Directly from Charts
Analyze price movements and place trades seamlessly from charts using Indiabulls Securities Limited chart-driven trading interface.
Smart Trading, Made Simple
Powerful tools packed with colorful clarity to elevate your investing game.
Visualize the order landscape
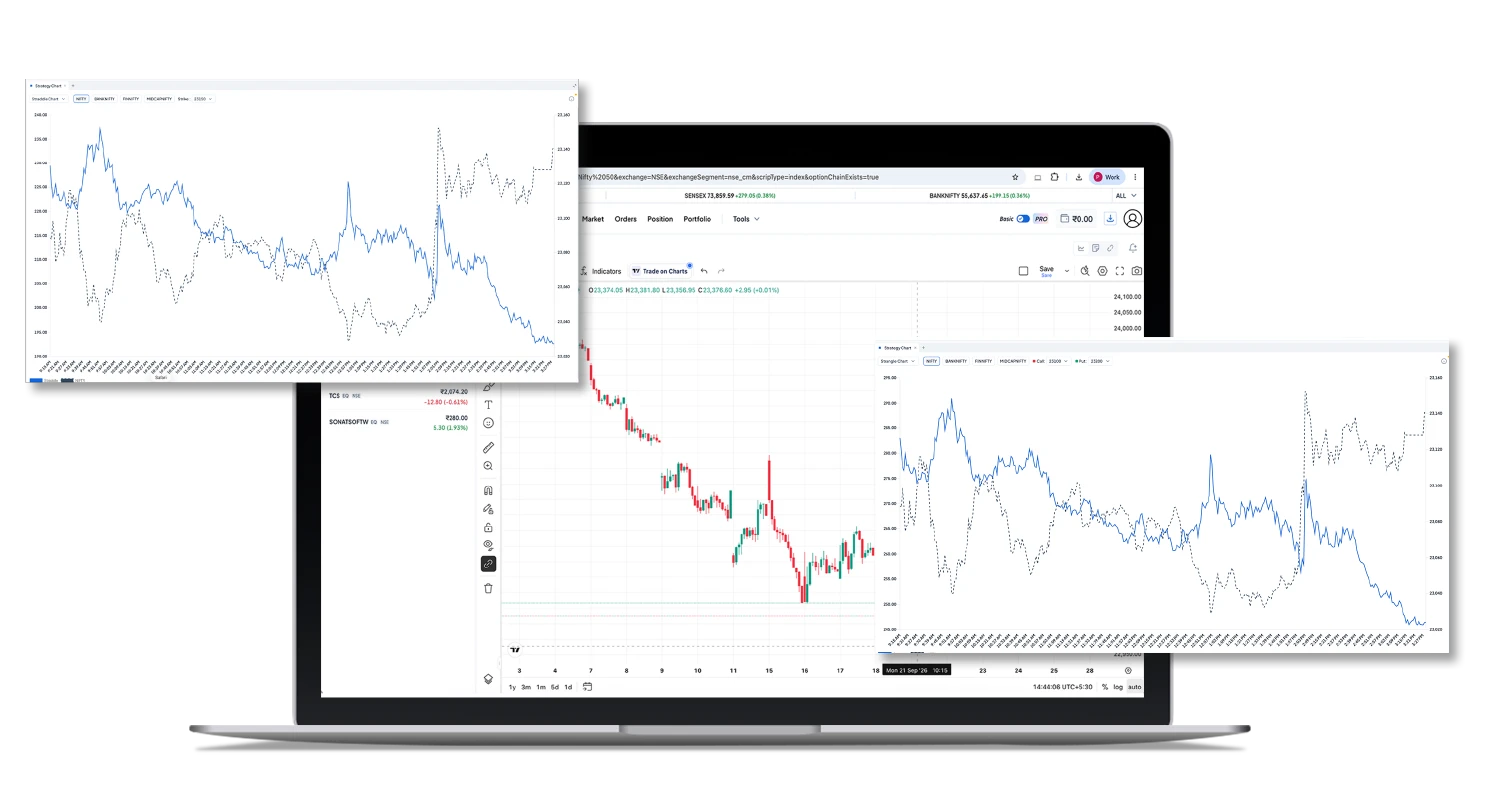
Experience absolute positioning clarity. Chart-integrated order overlays present structural market context effortlessly, removing the divide between active state and dynamic graphs.
Chronicle of executed positions
Retrieve historical fill logs rendered cleanly against temporal trade records.
Price-aligned level tracking
Seamless alignment of portfolio markers with immediate pricing variables.
Comprehensive trade oversight
Observe global leverage risks and asset distribution from a single editorial interface.
Chart trading allows traders to analyze price action visually and place buy or sell orders directly from charts, reducing manual steps and improving execution efficiency.
With Indiabulls Securities ltd, chart trading is designed to support:

Faster decision-making
Reduced execution errors
Better alignment between analysis and trade placement
See orders live on charts
Watch exactly where your buy and sell levels sit in real time without digging through tabs.
Track every trade at a glance
Past fills are plotted directly on the graph so you always know your history.
Watch positions move with price
Floating tags show current profit or loss exactly where prices change.
Stay on top of your portfolio
Keep tabs on multiple stocks, crypto, and assets simultaneously.
Interactive Charts
Multiple chart types (Candlestick, Line, Area, etc.)
Adjustable timeframes from intraday to long-term
Zoom, scroll, and drawing tools
Clean and responsive interface
Chart-Based Order Placement
Place Buy/Sell orders directly from the chart
Visual price level selection for entry
Quick modification or cancellation of orders
Clear visibility of executed and pending orders
Important Clarifications
Charting tools are provided as analysis and execution support features
Indiabulls Securities does not claim ownership of third-party charting platforms
Chart-based trading functionality is offered within the Indiabulls Securities ltd trading ecosystem
Availability of tools and indicators may vary by platform
Why Use Chart Trading with Indiabulls Securities ltd
Visual and intuitive trade execution
Reduced manual errors
Faster alignment between analysis and action
Secure and compliant trading environment

Different Types of Charts Used in Technical Analysis: Line, Bar, and Candlestick Charts
If you've ever wondered how traders catch trends early or exit a trade just before the market revers...
Read More
Open Interest (OI) Explained: How to Read OI Charts for Support and Resistance
What open interest measures, how it differs from volume, and how to turn Call OI and Put OI into support and resistance levels on IBT-ProTrade.
Read More
Mastering Stock Market Charts: Unveiling Patterns and Candlesticks for Successful Trading
The world of stock market trading has evolved significantly over the years, thanks to technological ...
Read More
How Can I Develop a Trading Strategy Based on Technical Analysis?
Investing money in stocks and waiting to see how it turns out is one thing, but effective trading to...
Read More
Price Action Trading: Meaning, Advantages & Strategies
Learn what price action trading means, explore its key advantages, and understand popular strategies to analyse market movements and make informed trading decisions.
Read More
What is Swing Trading? Strategies, Benefits & Risks Explained
Understand what swing trading is, explore popular strategies, key benefits, risks, and essential factors to consider before using this short to medium term trading approach.
Read More
Risk Disclosure
Trading based on charts and technical indicators involves market risk.
Charting tools assist analysis but do not guarantee outcomes.
Clients are responsible for their trading decisions and risk management.
All orders are executed as per exchange and regulatory guidelines.