


Home
F&O Analytics
Because successful derivatives trading starts with knowing what's building, what's repeating & who's participating
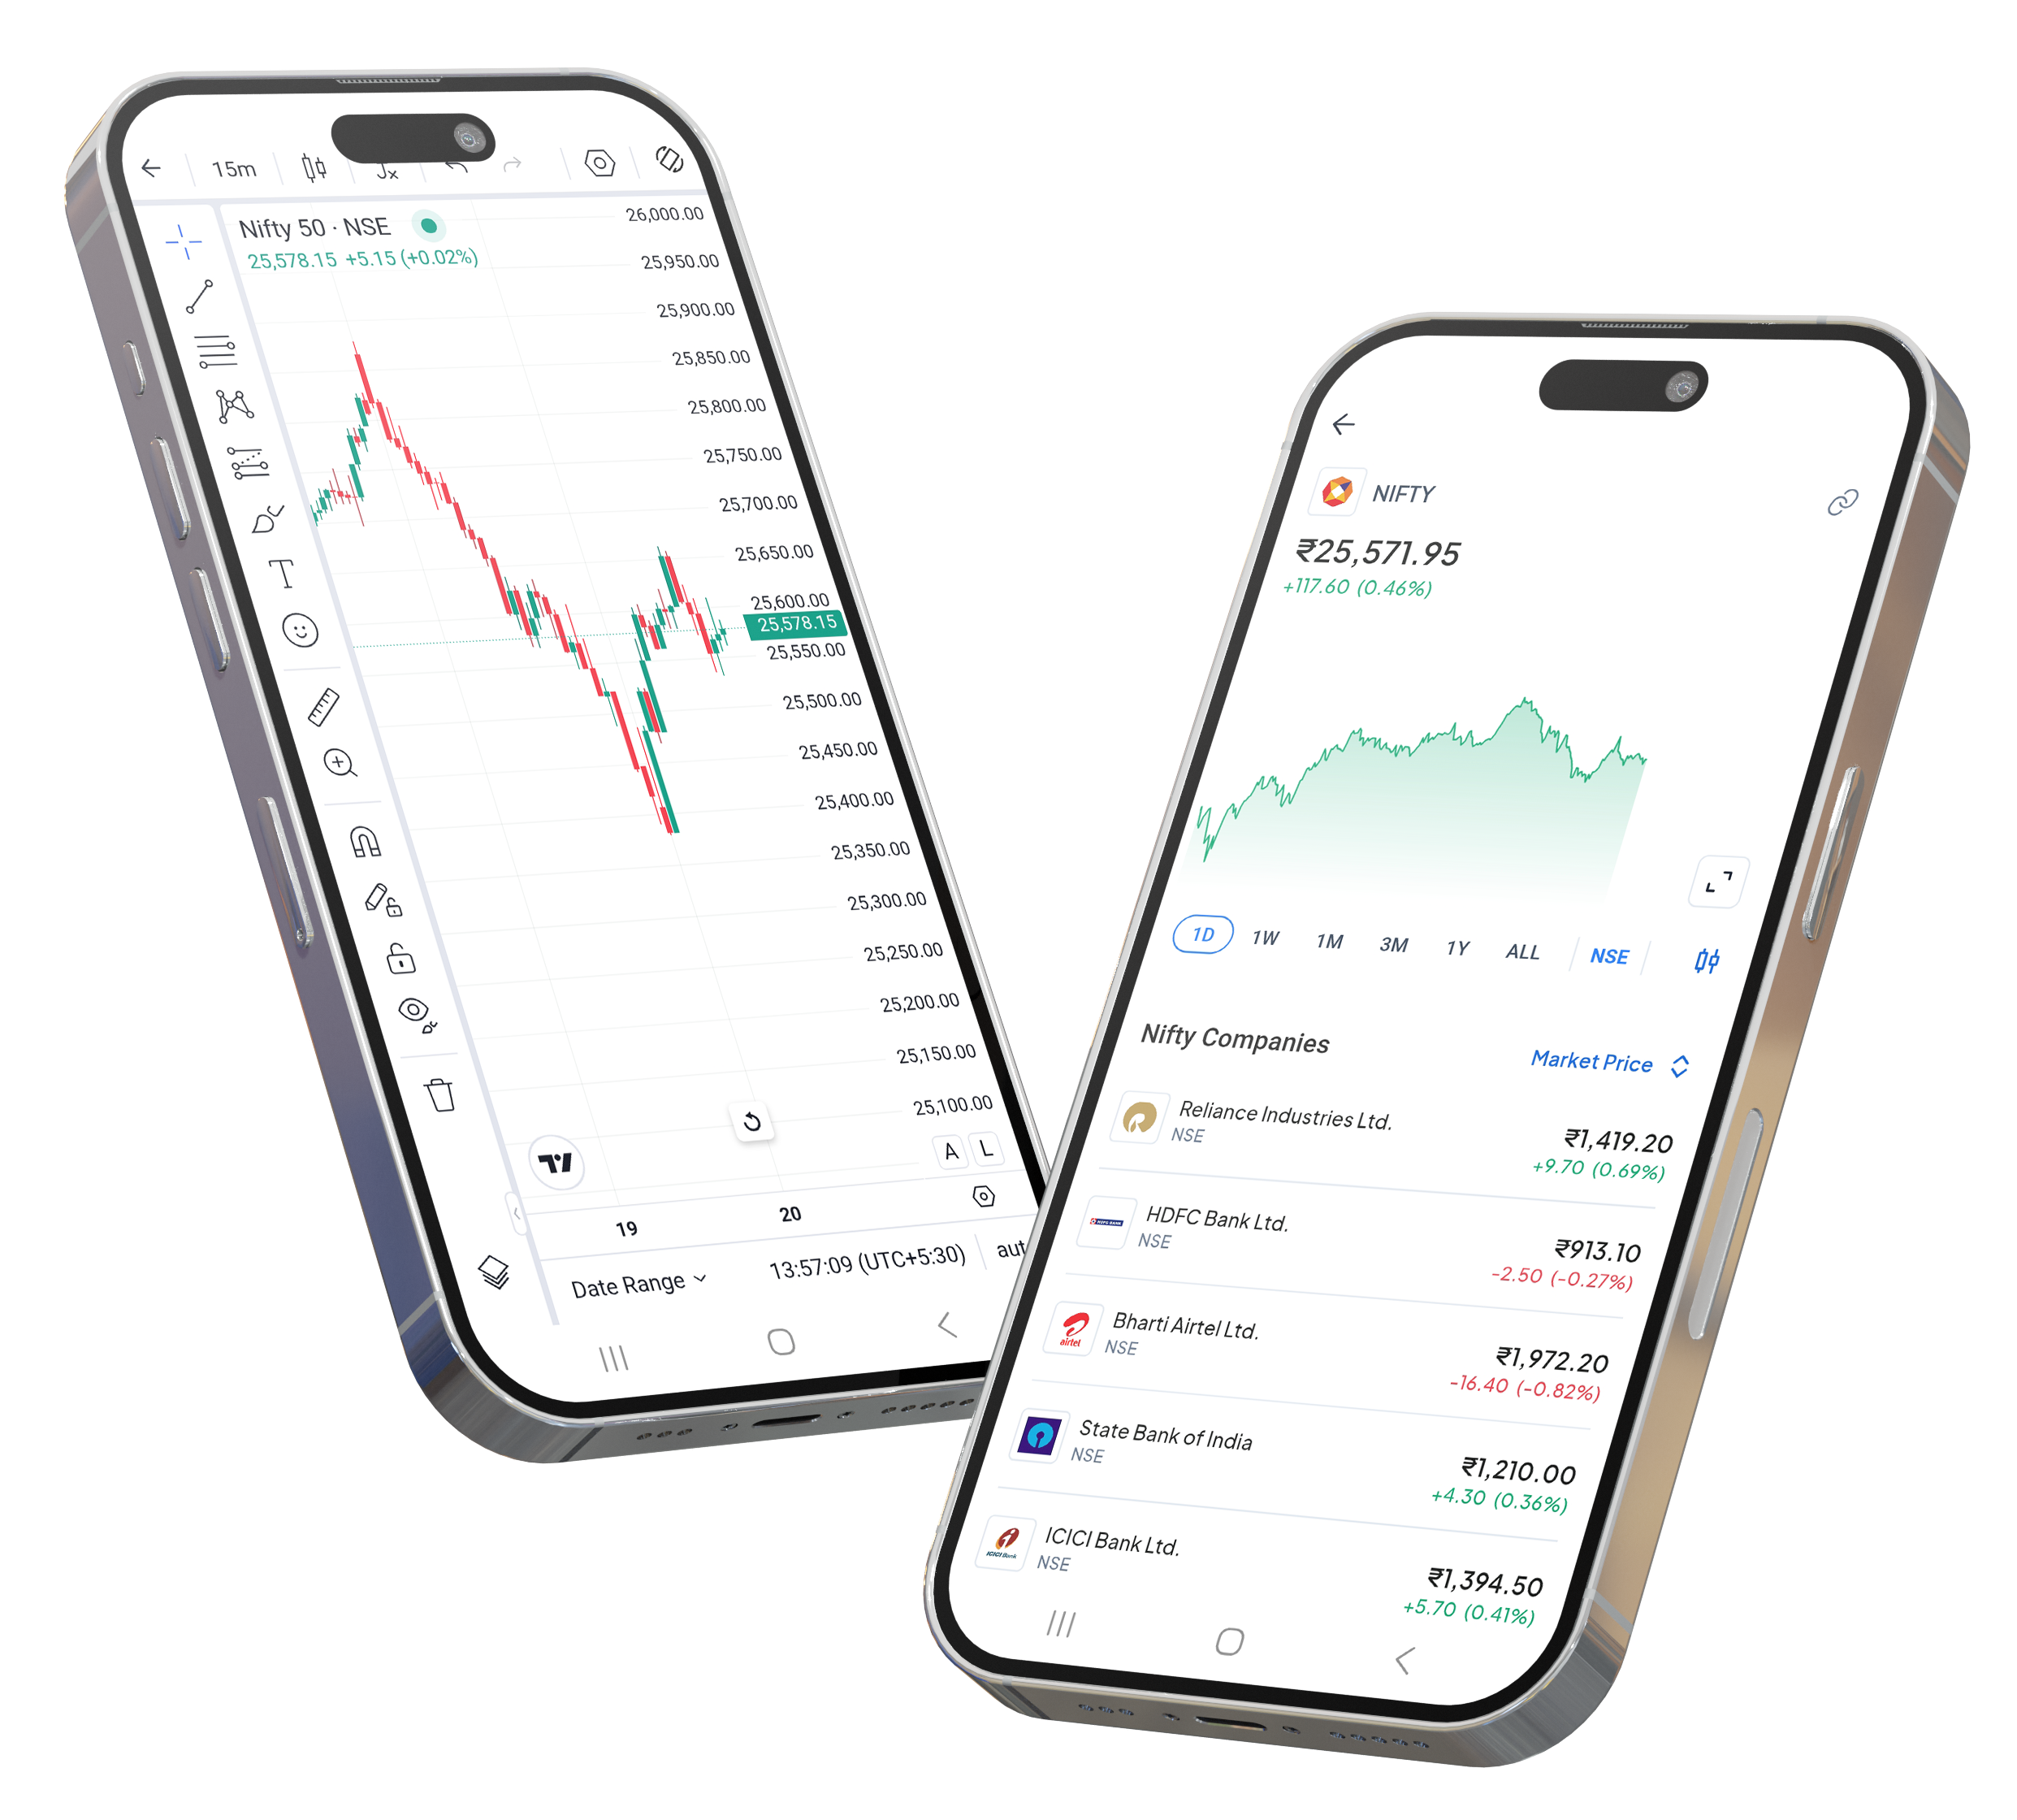
F&O Analytics brings together Open Interest behavior, historical positioning, and institutional activity to help traders move beyond guesswork and trade with informed conviction. This pre-login analytics suite is designed to reveal trend strength, sustainability, and market participation across futures and options.
Futures Analytics
Understand Positioning Behind Futures Price Moves
Futures Screener
Scans futures contracts to highlight instruments with significant activity and meaningful buildup, helping traders focus on liquid and active markets
Intraday Long / Short Built-Up
Classifies futures movement into long buildup, short buildup, short covering, and long unwinding using price and OI behavior.
Trader Benefit:
- • Confirms trend strength intraday
- • Aligns trades with dominant market positioning
Contract-Level Metrics
Provides detailed insights such as OI change, volume, price change, and participation strength for deeper contract-level evaluation.
Options Activity Dashboard
Spot Where Options Are Turning Active
Intelligent screeners highlight notable changes in option contracts based on volume, open interest, price movement, and participation metrics.
How traders use it:
- • Identify contracts showing unusual activity
- • Focus on strikes with fresh participation
- • Discover volatility and momentum opportunities early
(For informational use only.)
OI Built-Up
Know Where Positions Are Being Created
OI Built-Up tracks real-time changes in open interest to identify whether fresh positions are entering the market or existing ones are being unwound.
Usage for traders:
- • Validate price moves with participation
- • Detect trend continuation or exhaustion
- • Improve entry timing using OI + price
Historical Built-Up
Identify Patterns That Repeat Over Time
Historical Built-Up analysis allows traders to study past OI and price behavior across expiries and timeframes.
Usage for traders:
- • Recognize recurring buildup patterns
- • Understand how markets behaved in similar conditions
- • Strengthen strategy planning using historical context
- •Displays the combined price of Call and Put options at the same strike price.
- •Helps analyse market-implied volatility and price movement expectations.
- •Used for monitoring premium behaviour around the spot price.
FII / DII Data
Track Institutional Participation
FII and DII data provides visibility into institutional buying and selling activity across derivatives and cash segments.
Usage for traders:
- • Gauge smart money flow
- • Align trades with institutional bias
- • Avoid trading against strong participation trends
Index Contributors
See What’s Driving the Index Move
Breaks down how individual stocks contribute to overall index movement, helping traders understand whether index action is broad-based or heavyweight-driven
How Traders Use F&O Analytics
- • Combine OI, historical patterns, and institutional data
- • Validate trends before committing capital
- • Improve strike, instrument, and timing selection
- • Trade with clarity backed by participation data
Trade With Insight, Not Noise
F&O Analytics converts complex derivatives and institutional data into actionable intelligence, empowering traders to understand who is active, what is building, and whether a trend can sustain.
Because in F&O trading, knowing the data behind the move makes all the difference.
Frequently Asked Questions
FnO Analytics is a futures market analysis tool that presents data such as OI build-ups, price movement, intraday activity.